Input Costs Drop -0.8% w/w, -2.8% y/y bringing Low End Consumer Relief. HSY, Wing Restaurants Leading Cost Tailwinds. Friday Cost Factor
Optimal Advisory Cost Factor – Energy joined the cost decline party this week on macro concerns – albeit still +24% off 12 month low. Last week’s surprise tariff reduction on key CPG inputs augments an even more favorable U.S. food, beverage & restaurant sector 2026 input cost outlook.
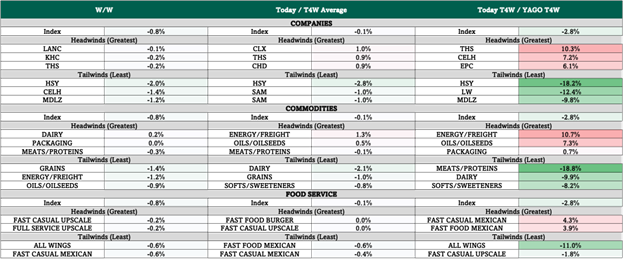
Cost Factor -0.8% w/w, -2.8% y/y (vs. prior week flat w/w & -3.1% y/y). 23/32 measured commodities flat or down w/w. Largest w/w tailwinds include cocoa (-7% w/w) and cheese ( -6% w/w). See Fig 1-7.
Cost headwinds: THS (-0.2% w/w, +10.3% y/y), Energy/Freight (-1.2% w/w, +10.7% y/y)
Cost tailwinds: HSY (-2.0% w/w, -18.2% y/y), Dairy (-9.9% y/y), wing restaurants (-11% y/y) & upscale fast casual restaurants (-1.8% y/y)). See Fig 1.
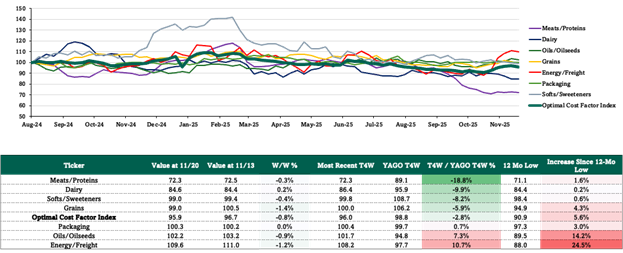
Restaurants feeling huge center plate cost tailwinds ex beef. Pricing for Hogs and Live Cattle are down sharply m/m (-19.4% and -8.2% respectively) helping center plate costs. In context, beef is still the largest tracked headwind (+19.6% y/y) to the meats/proteins category while chicken (-23% y/y) and egg (-50% y/y) prices have been steady tailwinds driving the category. See Fig 3.
Cost tailwinds: Meats/Proteins (-18.8% y/y, vs. prior week -20% y/y)
Cost headwind: Live Cattle (+19.6% y/y)
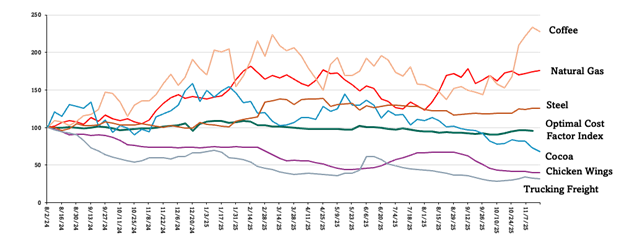
Tariff relief augments rosy cost outlook for Food Producers. Last Friday, the Trump administration announced the immediate rollback of tariffs on dozens of food related items, bringing the largest potential margin relief to MKC (+200 bps), CAG (+180 bps) & HSY (+175 bps) on top of cost relief. Our Food Producer cost index is down overall (-3.8% y/y) with Cocoa (-42.6% y/y) and Steel (+26.0% y/y) providing the most actionable cost relief (HSY, CPB). See Fig 4-8.
Costs could bring macro relief. Food (at home & restaurants) represents approximately 39% of discretionary spending for households under $90k (2023 BLS Consumer Expenditure Survey). After relentless inflation since 2019, modest decline in food inputs represents considerable potential relief.
In this weekly note, we identify spot input costs’ putative impact on the U.S. consumer value chain, most measurably impacting staples, staples retailers, restaurants & food service. Optimal’s proprietary cost factor weights ticker & sector specific cost trends using a proprietary formula based on 32 trackable spot cost inputs – 23 of which are updated as of last night, the other 9 latest available.
Figure 1: Weekly Cost Factor Summary
Sources: Optimal Advisory Proprietary Analysis, Bloomberg, FRED, USDA, BEA
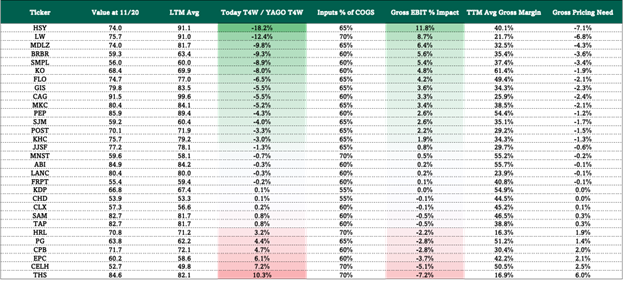
Figure 2: Weekly Cost Factor Margin Context
Sources: Optimal Advisory Proprietary Analysis, Bloomberg, FRED, USDA, BEA
Figure 3: Weekly Input Commodity Performance by Group
Sources: Optimal Advisory Proprietary Analysis, Bloomberg, FRED, USDA, BEA
Figure 4: Biggest Input Cost Movers y/y
Sources: Optimal Advisory Proprietary Analysis, Bloomberg, FRED, USDA, BEA
Figure 5: Food Sector Cost Factor
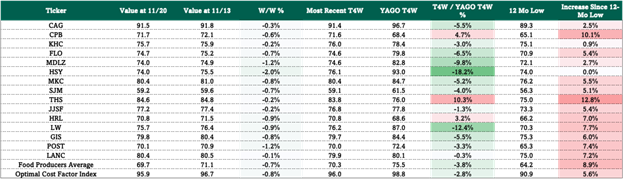
Sources: Optimal Advisory Proprietary Analysis, Bloomberg, FRED, USDA, BEA
Figure 6: Beverage Sector Cost Factor
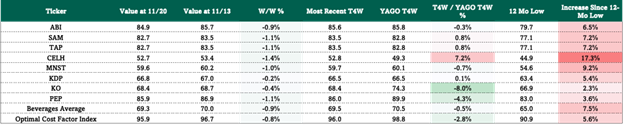
Sources: Optimal Advisory Proprietary Analysis, Bloomberg, FRED, USDA, BEA
Figure 7: HPC Sector Cost Factor

Sources: Optimal Advisory Proprietary Analysis, Bloomberg, FRED, USDA, BEA
Figure 8: Restaurant Level Cost Factor

Sources: Optimal Advisory Proprietary Analysis, Bloomberg, FRED, USDA, BEA
Figure 9: Restaurant Employment Cost Index
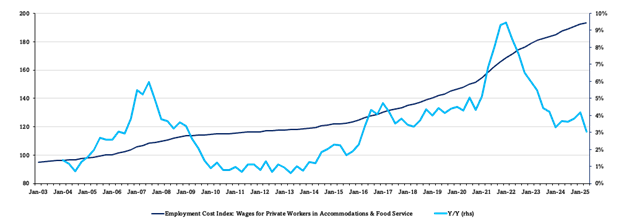
Sources: Optimal Advisory Proprietary Analysis, Bloomberg, FRED, USDA, BEA
Figure 10: Staples Sector Theme Box
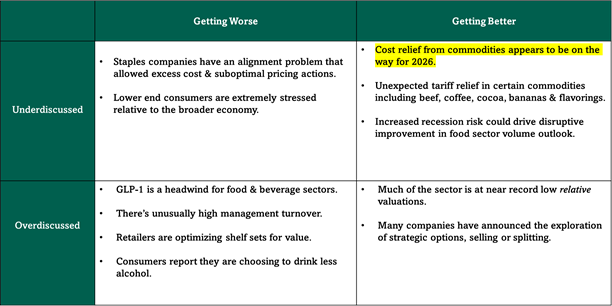
Figure 11: Market Sector Performance
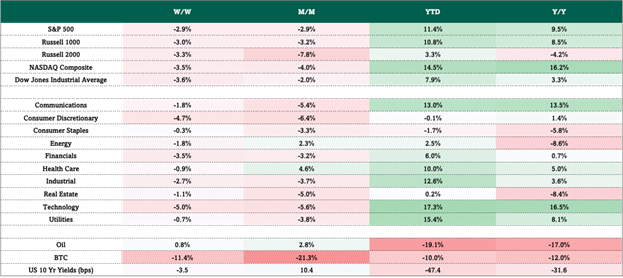
Sources: Optimal Advisory Proprietary Analysis, Bloomberg