Consumer Deceleration Continued Thanksgiving Week / Premium Trend Remains Softer than Value / Gas Prices Now Slight Headwind: Macro Monday
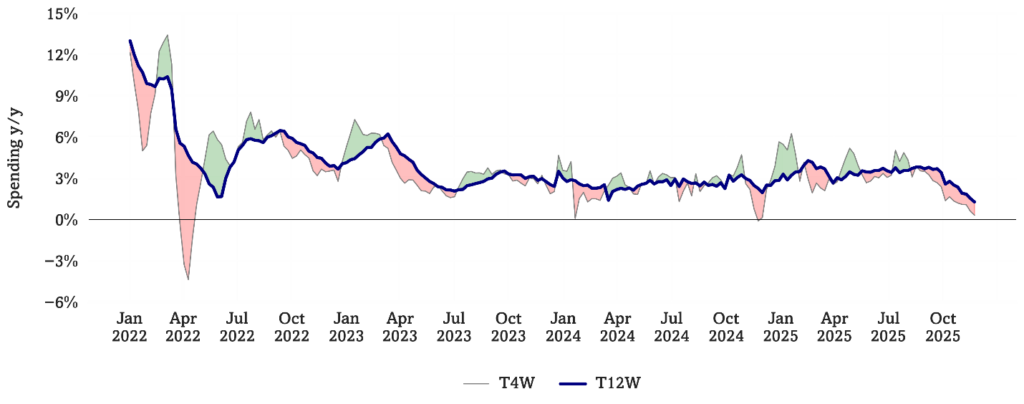
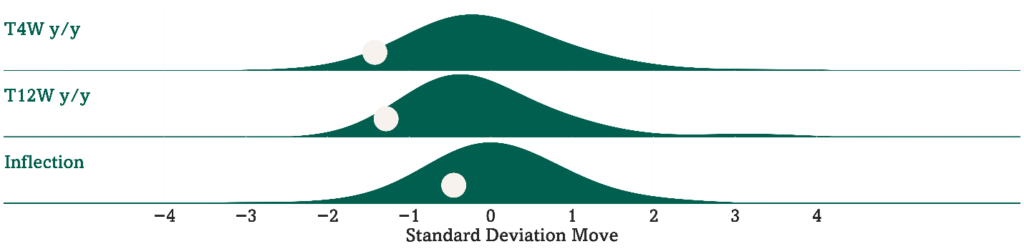
Consumer Velo continued to decelerate last week. Shorter-term spending trend decelerated further last week, now running up +0.3% y/y (this was running 3%+ just two months ago, now running 1.4 standard deviations below average since the start of 2022). The longer-term trend is running up +1.3% y/y, leading to a shorter vs. longer-term inflection of -1.0% (0.5 standard deviations below average), the 14th straight week of shorter-term trends running below longer-term trends. See Fig 1-2.
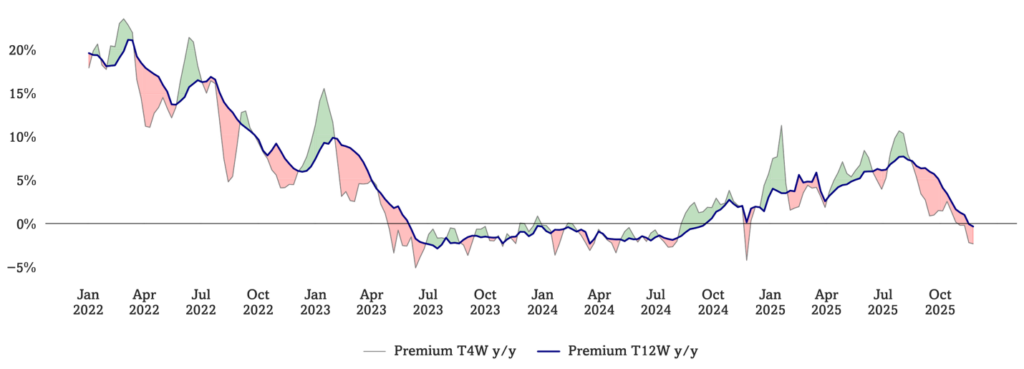
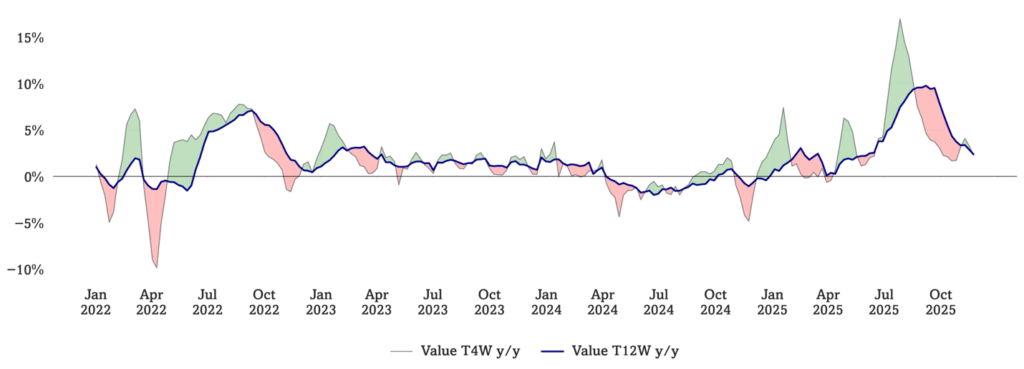
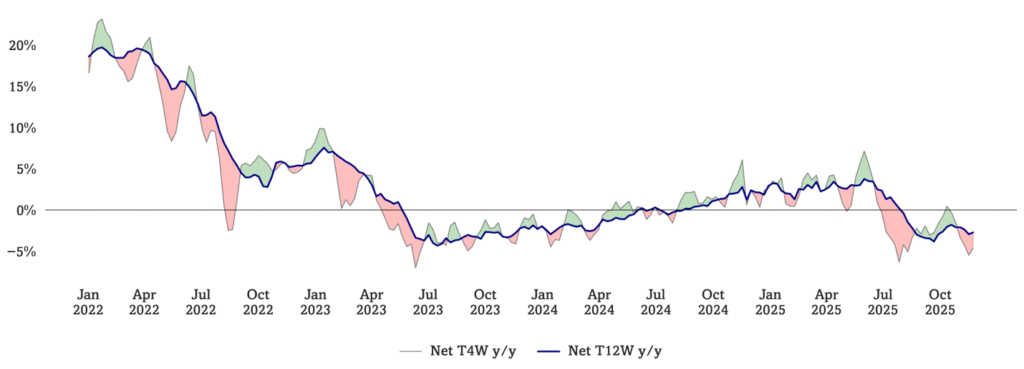
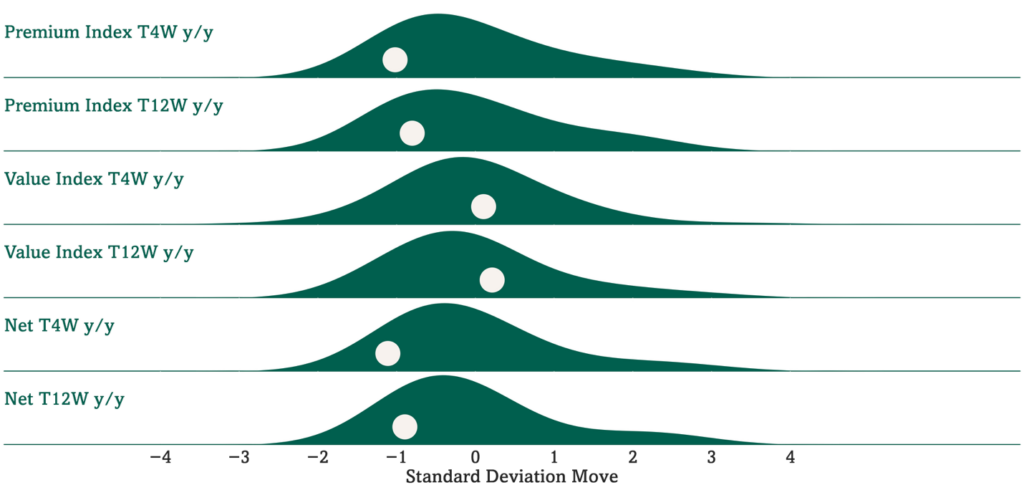
Premium vs Value Monitor continues to suggest softer high-end trends, rate-of-change more stable. Optimal’s premium monitor is running down -2.3% y/y on a T4W basis and flat y/y on a T12W basis, running 460 bp (1.1 standard deviations below average) and 270 bp (0.9 standard deviations below average), respectively below our Value Monitor, which is running up +2.2% y/y on a T4W basis and +2.3% y/y on a T12W basis. We use a combination of consumer spending and psychographic monitoring. See Fig 3-6.
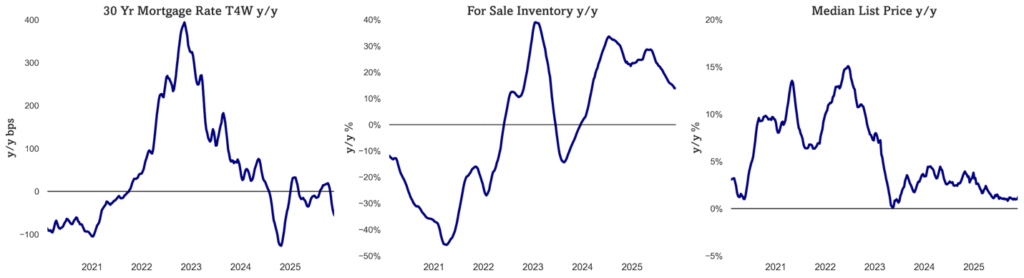
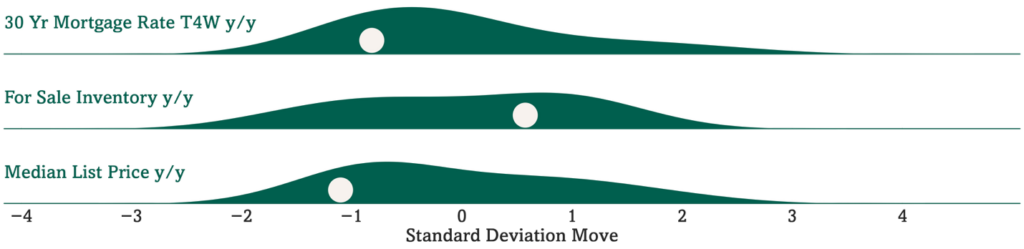
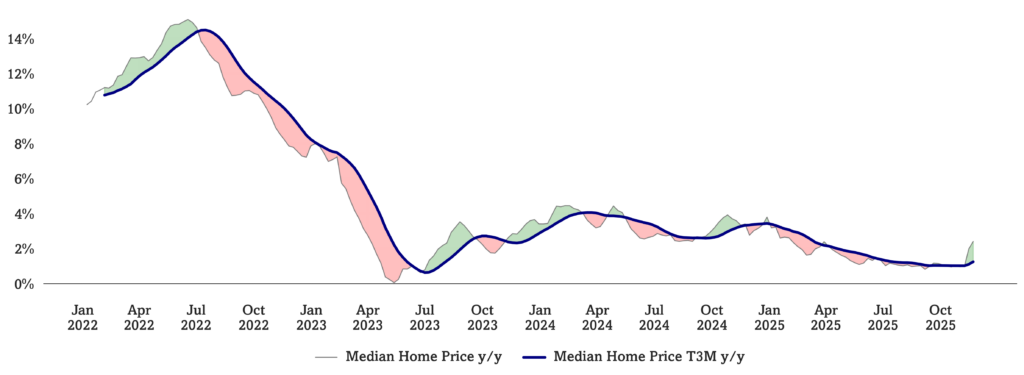
Housing Kinetic Energy remains positive (lead indicator) as mortgage rates move lower and home prices move higher. US 30Y FRM rate continuing to move lower, now running down -56bps y/y on a T4W basis. MBA’s mortgage applications for purchase are currently running +24% y/y. Inventory available for sale continues to run up +13.9% y/y but has decelerated from +30% y/y in May of this year. We note supply build in “canary in the coalmine” markets like Miami. Median home prices are running up +1.2% y/y (1.1 standard deviations below average since 2020). The point here is that the preconditions are arising for more turns in 2026 – not that home-related spending strong in 4Q25. Roughly 18% of Americans sell, build, fix, lend to, and furnish homes – velocity matters for the economy. See Fig 7-10.
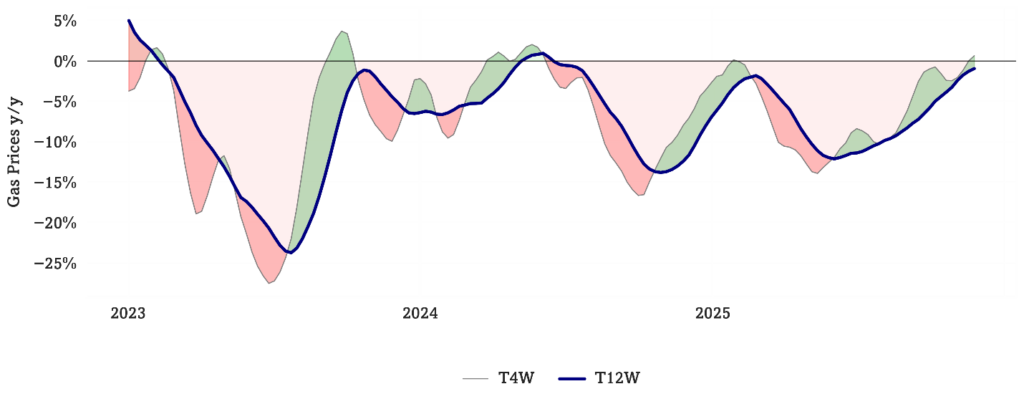
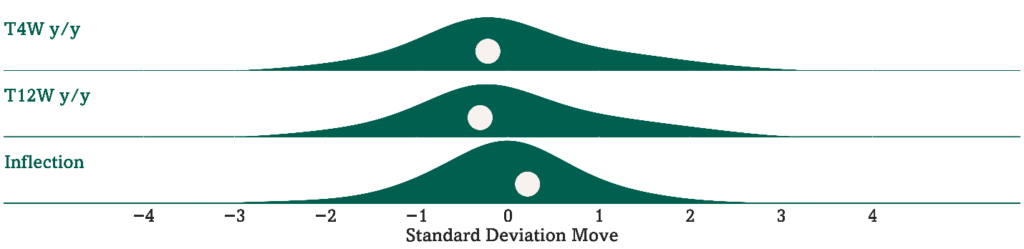
Gasoline prices are now running up y/y on a shorter-term basis, notable for lower-income consumers. Gas prices ran up +0.6% y/y on a T4W basis (following 41 weeks of y/y declines and one week of flat growth) and declined -1.0% y/y on a T12W y/y basis, corresponding to a +1.6% inflection between shorter and longer-term trends (0.2 standard deviations above historical trends), the 16th straight week of positive inflections. See Fig 11-12.
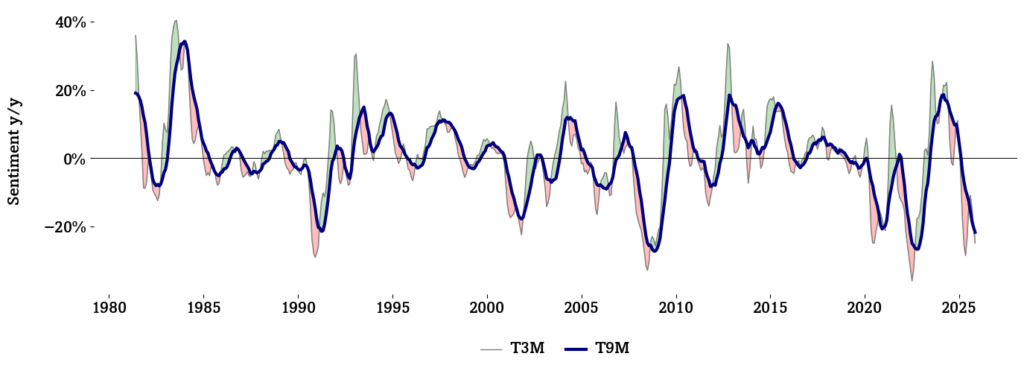
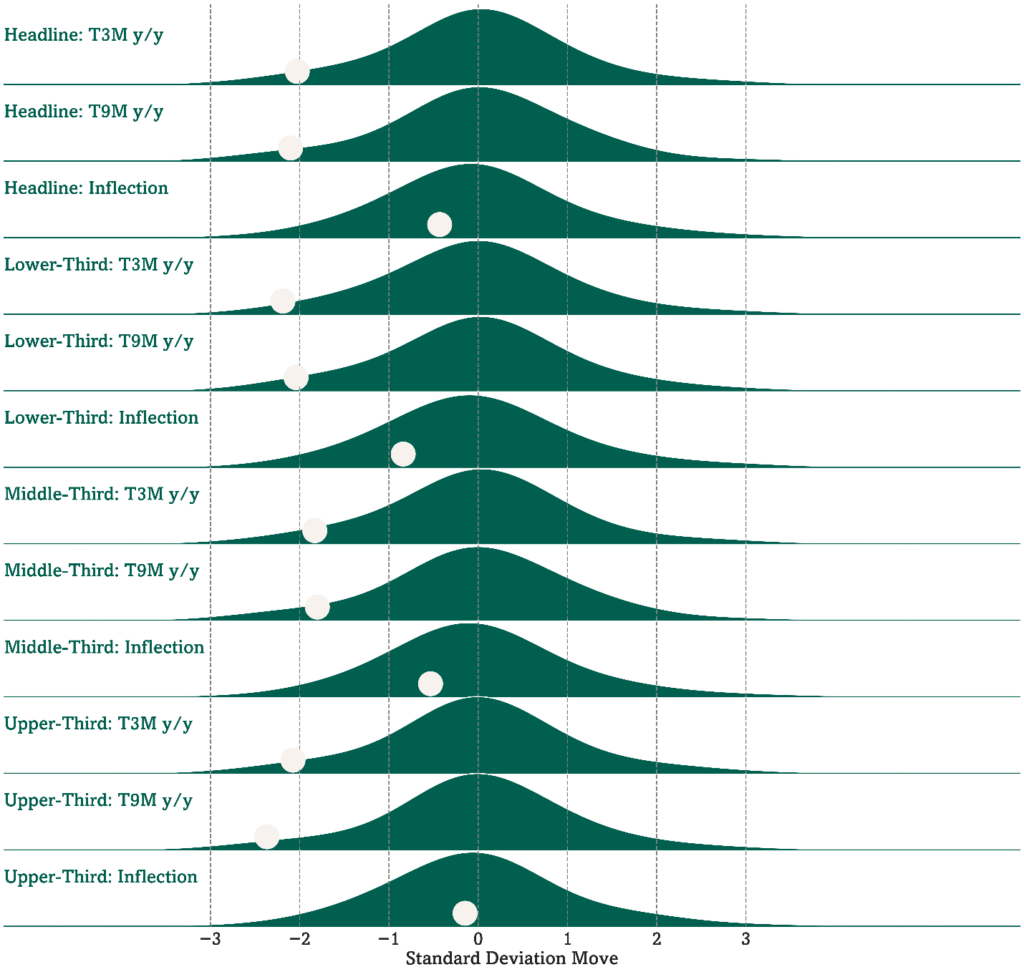
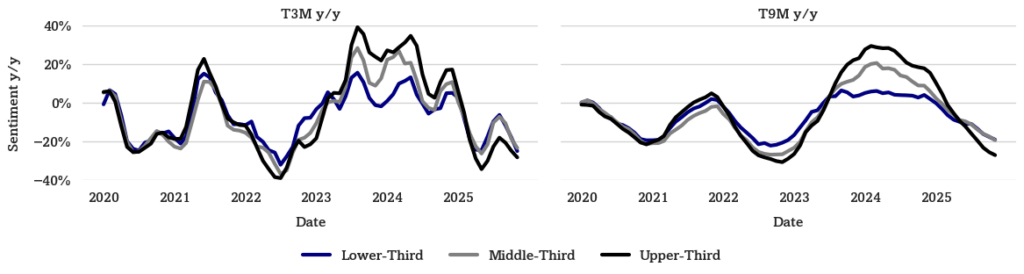
Consumer Sentiment is substantially lower y/y across incomes – just the 4th time this magnitude of y/y pullback has occurred since 1980. Headline Sentiment has declined -25% y/y on a T3M basis (2.0 standard deviations below average) and -22% y/y on a T9M basis (2.1 standard deviations below average). Upper-third income Sentiment has declined -28% y/y on a T3M basis (2.1 standard deviations below average), middle-income Sentiment has declined -24% y/y on a T3M basis (1.8 standard deviations below average), and lower-income Sentiment has declined -25% y/y on a T3M basis (2.2 standard deviations below average). See Fig 13-16.
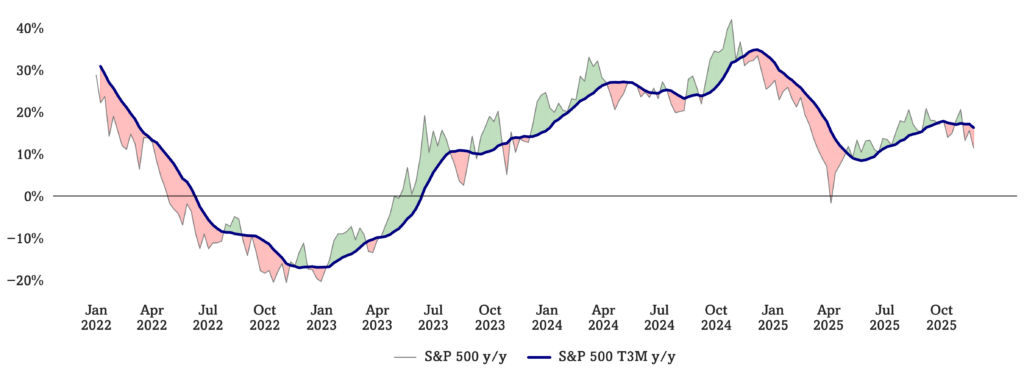
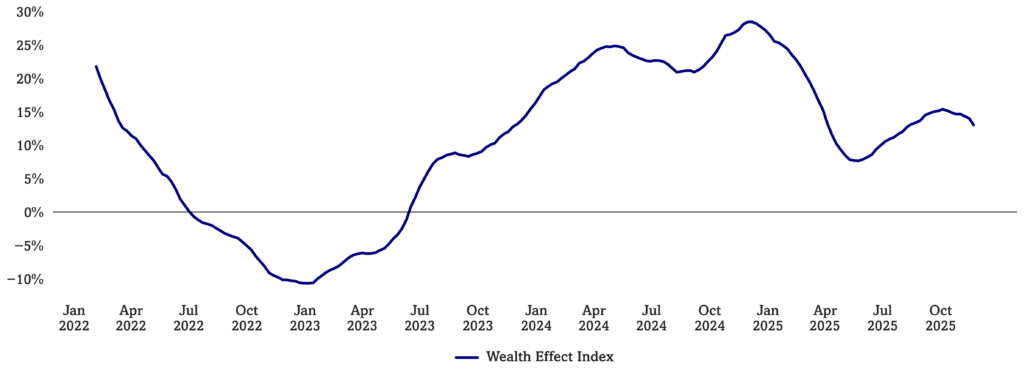
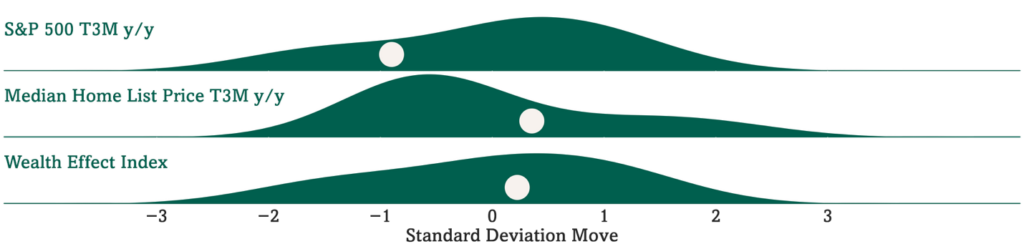
Wealth Effect Index trend remains above mean on y/y basis, with a downturn in the first derivative driven by volatility in financial markets. Optimal Advisory’s Wealth Effect Index is currently at 13.0% y/y (0.2 standard deviations above its mean value since the start of 2022) after peaking at 15.4% in late September. See Fig 17-20.
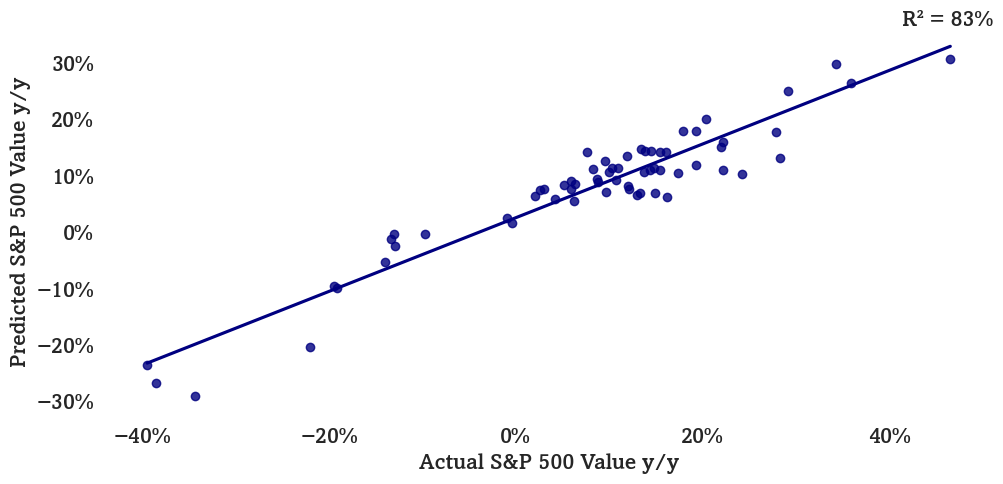
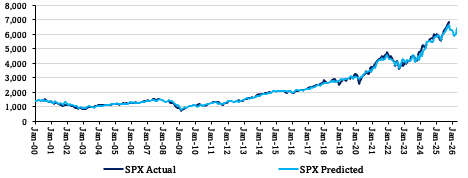
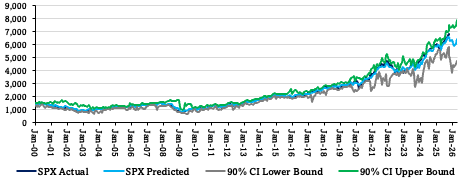
Multifactor Macro Market Model suggests a downturn, rebound. Optimal’s Multifactor Macro Market Model projects the S&P 500 as well as bull and bear cases based on lagged data for 12 macroeconomic factors. The model suggests the S&P 500 to fall to just below 6000 by next March, before rebounding back up to 6400 by May. See Fig 21-23.
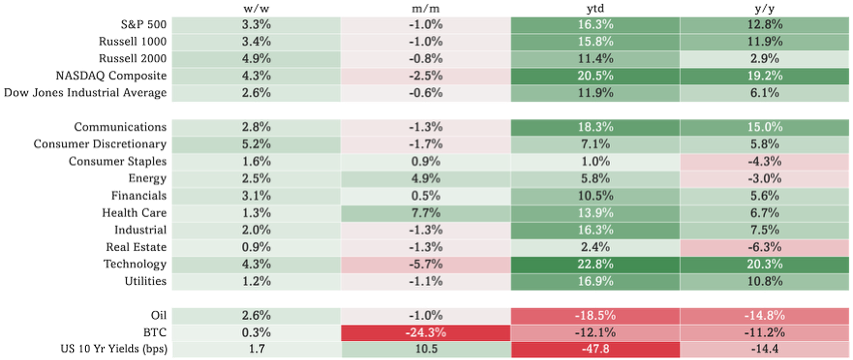
In this weekly note, we focus on key changes in the US consumer’s real-time dynamics (70% of the US economy). We also calculate and present the extent to which current dynamics are “non-normal”, relative to historic patterns. See Fig 24 for sector market performance.
Figures 1-2: Optimal Advisory Consumer Velocity Monitor
Source: Optimal Advisory Analysis, Bloomberg Second Measure
Consumer Spending y/y Relative to Historical Average
Source: Optimal Advisory Analysis, Bloomberg Second Measure
Figures 3-6: Optimal Advisory Premium vs Value Monitor
Source: Optimal Advisory Analysis, Bloomberg Second Measure, Google Trends
Optimal Advisory Premium vs Value Indices Relative to Historical Averages
Source: Optimal Advisory Analysis, Bloomberg Second Measure, Google Trends
Figures 7-10: Housing Kinetic Energy
Source: Optimal Advisory Analysis, Freddie Mac, Zillow, Redfin
Mortgage Rates, For Sale Inventory, & Median List Price y/y Relative to Historical Averages (Since 2020)
Source: Optimal Advisory Analysis, Freddie Mac, Zillow, Redfin
Figures 11-12: Gas Prices y/y
Source: Optimal Advisory Analysis, U.S. Energy Information Administration
Gas Prices y/y Relative to Historical Averages (Since 1992)
Source: Optimal Advisory Analysis, U.S. Energy Information Administration
Figures 13-16: Consumer Sentiment T3M and T9M y/y
Source: Optimal Advisory Analysis, University of Michigan Consumer Survey
Sentiment y/y by Income Tercile Relative to Historical Averages
Source: Optimal Advisory Analysis, University of Michigan Consumer Survey
Comparison of Sentiment y/y Across Income Terciles
Source: Optimal Advisory Analysis, University of Michigan Consumer Survey
Figures 17-20: Consumer Wealth Effect & Components y/y
Source: Optimal Advisory Analysis, Bloomberg, Zillow, Redfin
Median Home Price y/y, S&P 500 y/y, & Wealth Effect Index (Since 2022)
Source: Optimal Advisory Analysis, Bloomberg, Zillow, Redfin
Figures 21-23: Optimal Advisory Multifactor Macro Market Model
Historical Test Predictions vs. Actual (On Test Data Only)
Sources: Optimal Advisory Proprietary Analysis, Bloomberg, FRED, BLS, BEA, OECD, University of Michigan Consumer Sentiment Survey, U.S. Census Bureau, FRB
Actual & Projected S&P 500 (Including Training & Test Data)
Actual & Projected S&P 500 with Confidence Intervals
Sources: Optimal Advisory Proprietary Analysis, Bloomberg, FRED, BLS, BEA, OECD, University of Michigan Consumer Sentiment Survey, U.S. Census Bureau, FRB
Figure 24: Index & Sector Performance
Source: Optimal Advisory Analysis, Bloomberg, prices intraday 12/1/2025