Macro Monday – “Consumer Velo” Softens but Value Index Accelerated v. Premium; Persistent Meaningful Gas Price Declines; Wealth Effect Softens
We are hosting a Virtual Client Meeting on Housing / Midterms / Policy next Friday, 2/20 at 11 am ET with Ted Gayer. Ted is President of the Niskanen Center and previously worked at the Brookings Institution, where he held a variety of leadership roles including Executive Vice President from 2018 to 2022. During the GFC from 2007 to 2008, Ted was Deputy Assistant Secretary for Economic Policy at the Department of the Treasury, and from 2003 to 2004, he was Senior Economist at the President’s Council of Economic Advisers. Register Here for Meeting
Last week Optimal published on the $2.3 trillion global Sports Ecosystem, outlining forces at work and 44 companies in three subcategories. Report here: Sports Ecosystem Report
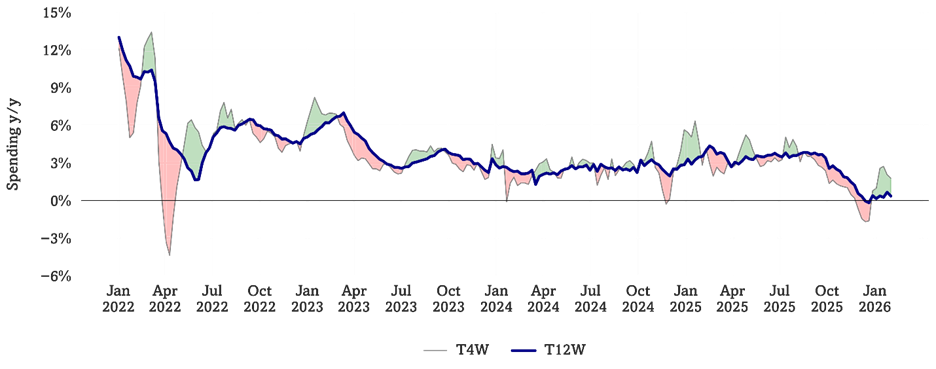
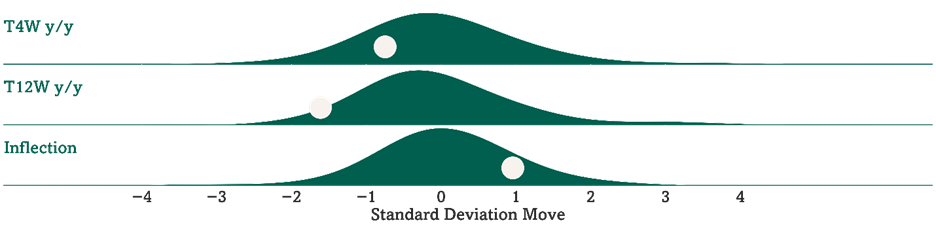
Consumer Velo was still positive last week, but softer than the prior two weeks, up +1.8% following +2.0% last week and +2.7% the week prior. For reference, this metric was running -1.6% y/y six weeks ago but up +3-4% in 3Q25. Our analysis of the trailing 4-week moving average of sales at 133 retailers and consumer concepts is running up +1.8% y/y (0.7 standard deviations below average since the start of 2022). The trailing Consumer Velo 12-week trend is up +0.3% y/y (1.6 standard deviations below average) vs. +0.6% y/y last week, leading to a shorter vs. longer-term inflection of +1.4% (1.0 standard deviations above average). See Fig 1-2.
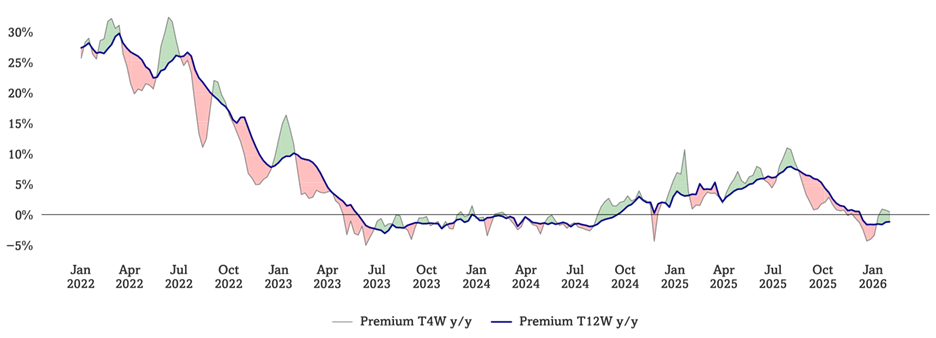
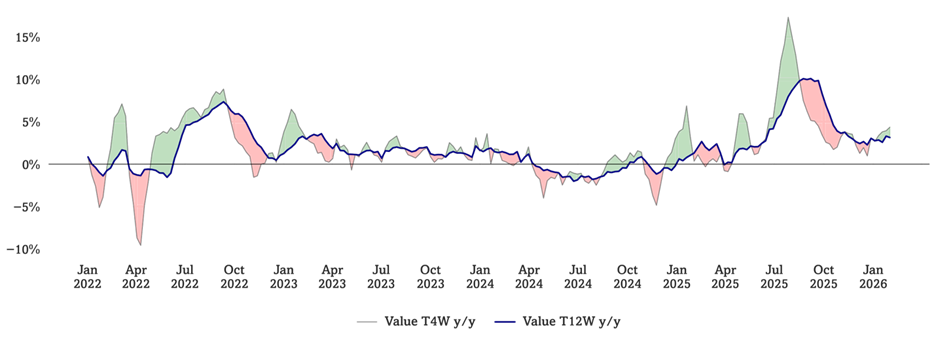
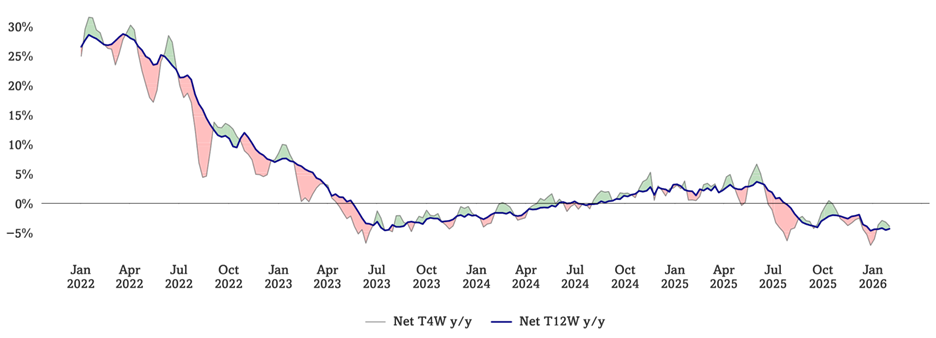
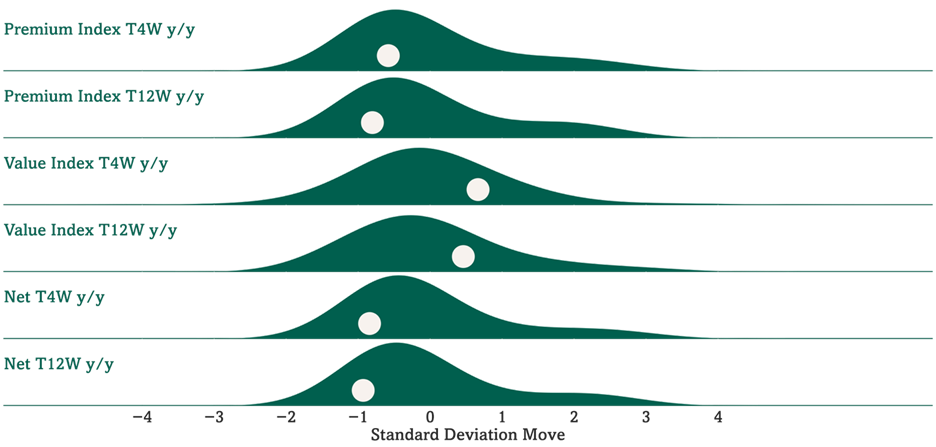
Our Premium Index is now tracking softer than the Value Index, we note Value spending continuing to inflect positively in the short-term, we believe tied to comparisons and persistent lower gas prices y/y. We use a combination of consumer spending and psychographic monitoring to track “trade up” and “trade down” trends. Optimal’s premium monitor is running up +0.4% y/y on a T4W basis and down -1.2% y/y on a T12W basis, running 390 bp (0.8 standard deviations below average) and 430 bp (0.9 standard deviations below average) respectively below our Value Monitor, which is running up +4.3% y/y on a T4W basis and up +3.1% y/y on a T12W basis. See Fig 3-6.
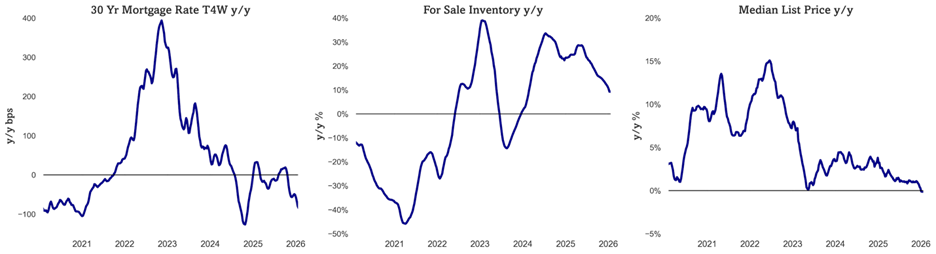
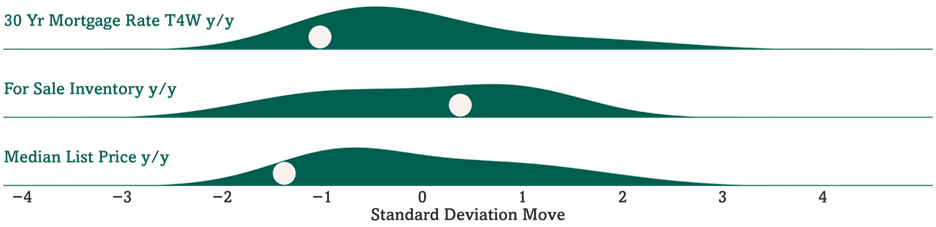
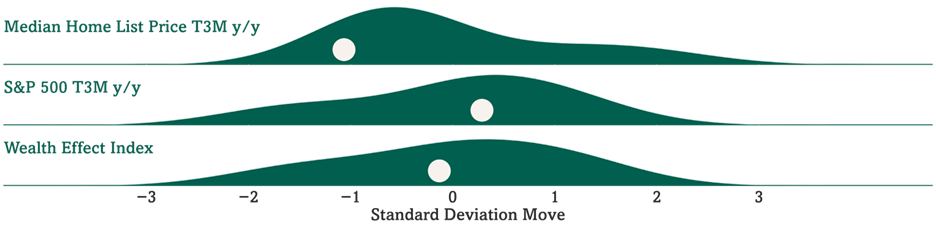
Consumer housing “kinetic energy” continues to show better signs for 2H26 activity; pickup in refinance applications as mortgage rates move to the lowest level since late 2024. We also note “canary in the coal mine” markets with pending sales y/y falling less than current transactions – a sign of potential market clearing activity. For sale inventory is running up +9.3% y/y (0.4 standard deviations above average) but at the lowest y/y level since early 2024. US 30Y FRM rate continues to run down, now running down -87 bps y/y on a T4W basis. MBA’s mortgage applications for purchase continue to run up +19% y/y while refinance applications running up +155% (a low base, but a necessary step to create eventual velocity). Median home prices are flat y/y (-1.4 standard deviations below average since 2020). Roughly 18% of Americans sell, build, fix, lend to, and furnish homes – velocity matters for the economy. See Fig 7-10.
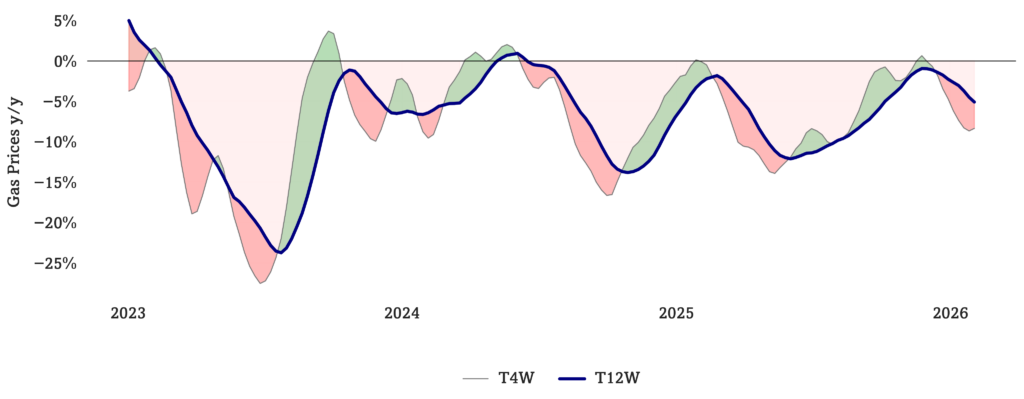
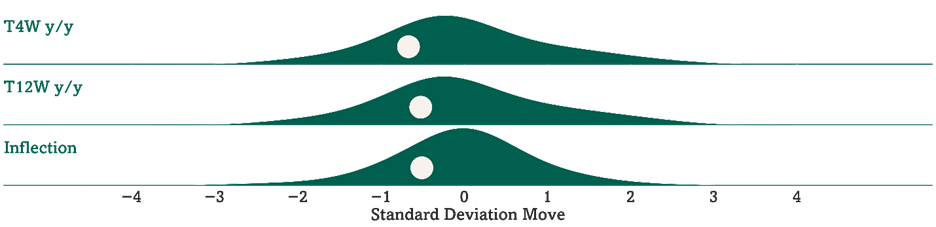
Gasoline prices continued meaningful y/y declines inflected positively – this can lead to more vehicle miles travelled (with weather, this can drive auto parts demand inflection). Gas prices ran down -8.4% y/y on a T4W basis, and are down -5.1% y/y on a T12W y/y basis, corresponding to a -3.3% inflection between shorter- and longer-term trends (0.5 standard deviations below average). We have had lots of recent conversations on oil and fuel prices due to developments in Venezuela. Markets are mixed on that thus far. Generally, lower-income consumers spend about 5% of their total spend on fuel, and higher-income consumers spend about 2.5% – so a 10% move in gas prices drives 25-50 bp headwind or tailwind. Utilities (electricity and heating fuel) run from about 9% of lower-income household spending to 4% for higher-income households. Duration of change matters – eventually causing Consumer Sentiment shifts, which then drive more or less discretionary spending. On the cost side, Feeney noted last week that the Optimal Cost Factor continues to work lower, down -10.8% y/y. Broad-based commodity price declines have pushed many measured ticker & sector cost indices lower. See Fig 11-12.
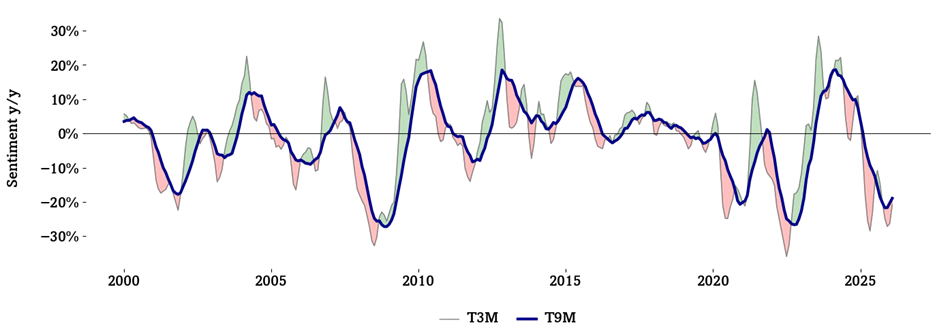
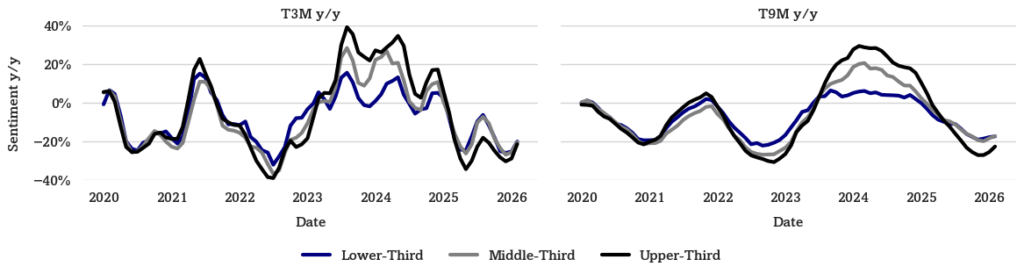
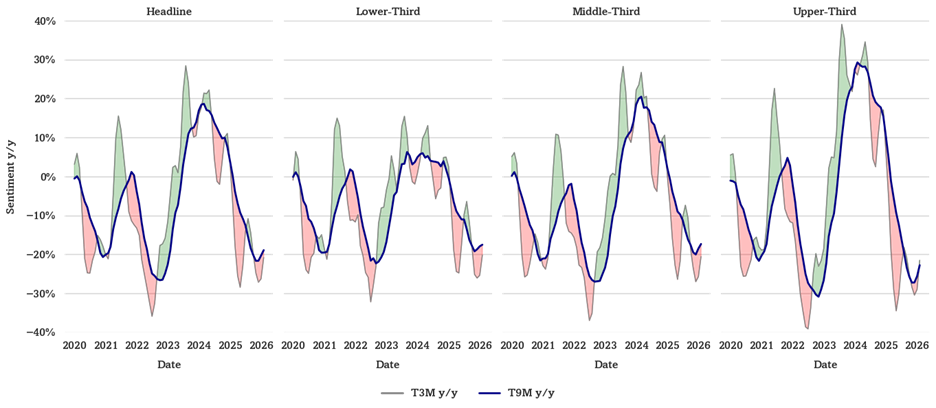
Rate of change is less bad for Consumer Sentiment as it is down -21% y/y over the past three months, but is only down -11% y/y in February for all respondents -7% for higher-income respondents. Overall, headline Sentiment has declined -21% y/y on a T3M basis (1.7 standard deviations below average) and -19% y/y on a T9M basis (1.8 standard deviations below average). This compares to -20% y/y on a T9M basis last month, marking the third month since late 2024 and fourth month since early 2024 where longer-term Sentiment y/y did not decrease from the prior month. Upper-third income Sentiment has declined -22% y/y on a T3M basis (1.6 standard deviations below average), after declining -29% y/y T3M last month. Middle-income Sentiment has declined -21% y/y on a T3M basis (1.6 standard deviations below average) compared to -26% last month, and lower-income Sentiment has declined -20% y/y on a T3M basis (1.7 standard deviations below average) compared to -25% last month. See Fig 13-16.
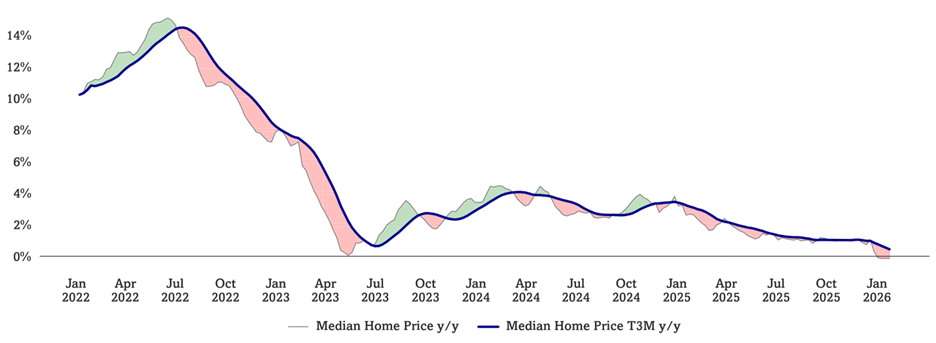
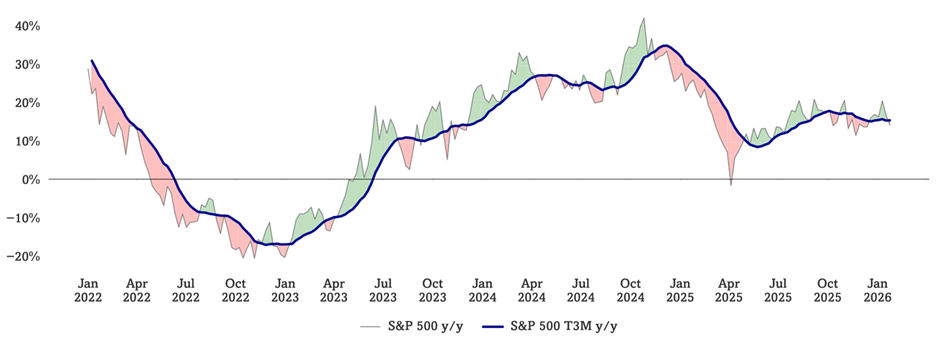
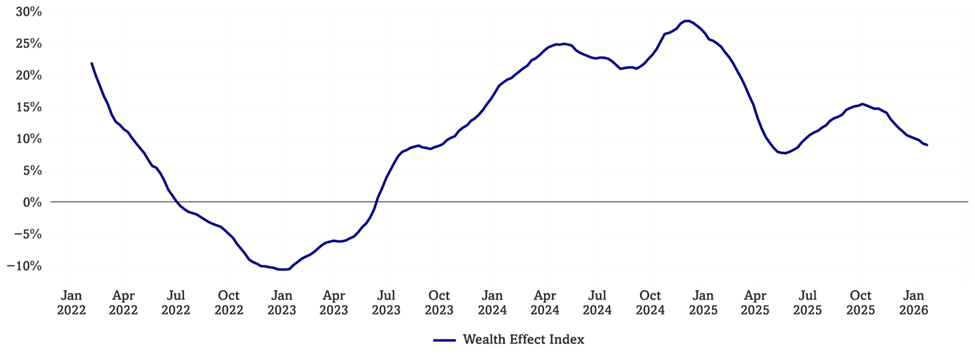
Consumer Wealth Effect Index continues to soften, now half of October 2025 level, driven by lower crypto prices. Optimal Advisory’s Wealth Effect Index is currently at 8.8% y/y (0.1 standard deviations below average since the start of 2022). This metric was running +15.4% y/y in October 2025. With home prices flat y/y and crypto returns sharply down in recent weeks we note the “flywheel” of wealth effect is more muted. See Fig 17-20.
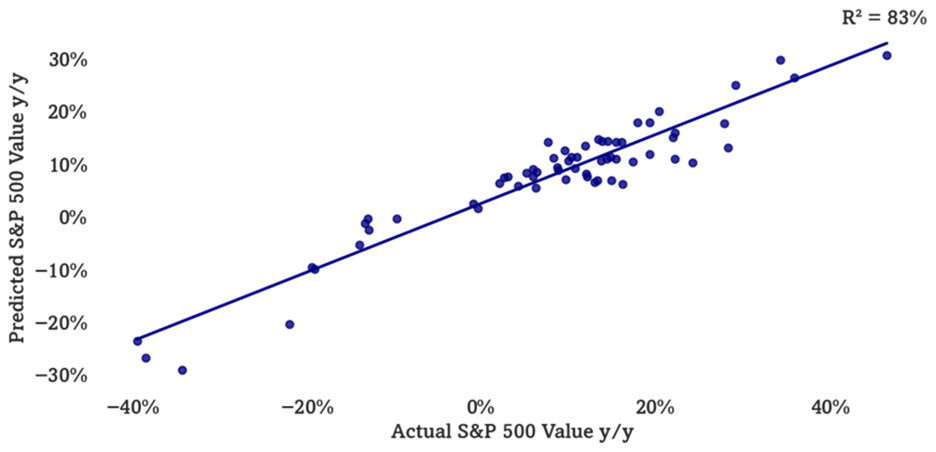
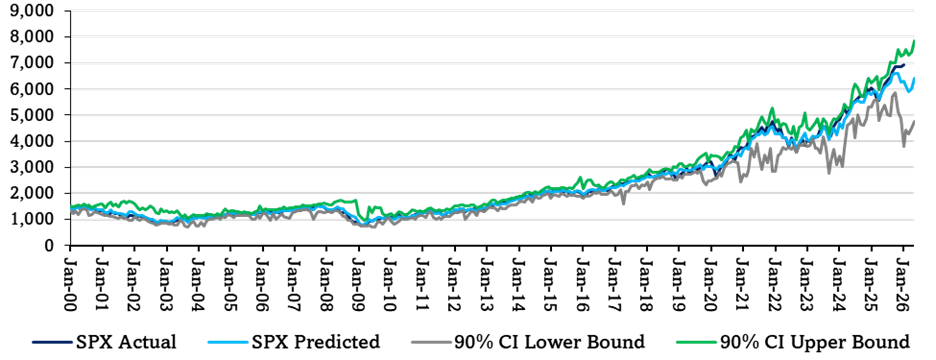
Multifactor Macro Market Model suggestive of softness, rebound. Optimal’s Multifactor Macro Market Model projects the S&P 500 as well as bull and bear cases based on lagged data for 12 macroeconomic factors. The model suggests the S&P 500 to fall to just below 6000 by next March, before rebounding back up to 6400 by May. We use this model as a guide to how macro would guide the market, given our analysis of current variables. This is, of course, outside of other factors at work. See Fig 21-22.
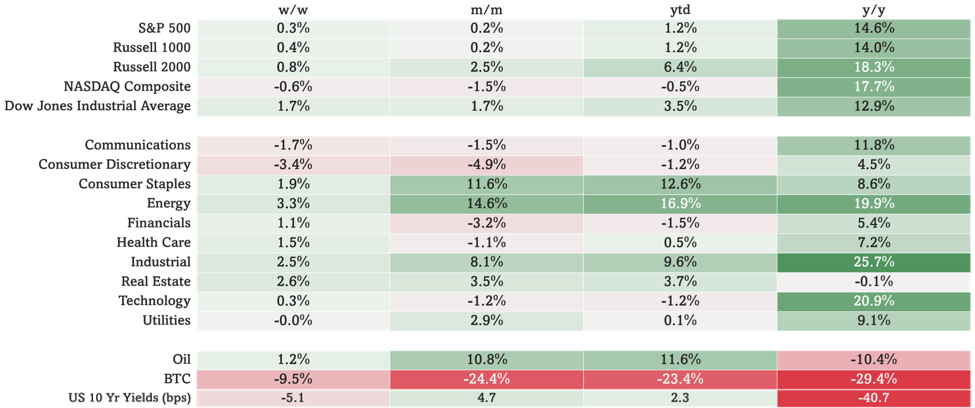
In this weekly note, we focus on key changes in the US consumer’s real-time dynamics (70% of the US economy). We also calculate and present the extent to which current dynamics are “non-normal”, relative to historic patterns. See Fig 23 for sector market performance.
Additional Upcoming Optimal Virtual Meetings
2026 Alcoholic Beverage Outlook – Virtual Client Meeting with President of Prestige-Ledroiten Center
Friday, February 27th @ 11AM ET
Hosted by: Jonathan Feeney – Managing Partner & Co-Founder
Figures 1-2: Optimal Advisory Consumer Velocity Monitor
Source: Optimal Advisory Analysis, Bloomberg Second Measure
Consumer Spending y/y Relative to Historical Average
Source: Optimal Advisory Analysis, Bloomberg Second Measure
Figures 3-6: Optimal Advisory Premium vs Value Monitor
Source: Optimal Advisory Analysis, Bloomberg Second Measure, Google Trends
Optimal Advisory Premium vs Value Indices Relative to Historical Averages
Source: Optimal Advisory Analysis, Bloomberg Second Measure, Google Trends
Figures 7-10: Housing Kinetic Energy
Source: Optimal Advisory Analysis, Freddie Mac, Zillow, Redfin
Mortgage Rates, For Sale Inventory, & Median List Price y/y Relative to Historical Averages (Since 2020)
Source: Optimal Advisory Analysis, Freddie Mac, Zillow, Redfin
Figures 11-12: Gas Prices y/y
Source: Optimal Advisory Analysis, U.S. Energy Information Administration
Gas Prices y/y Relative to Historical Averages (Since 1992)
Source: Optimal Advisory Analysis, U.S. Energy Information Administration
Figures 13-16: Consumer Sentiment T3M and T9M y/y
Source: Optimal Advisory Analysis, University of Michigan Consumer Survey
Sentiment y/y by Income Tercile
Source: Optimal Advisory Analysis, University of Michigan Consumer Survey
Comparison of Sentiment y/y Across Income Terciles
Source: Optimal Advisory Analysis, University of Michigan Consumer Survey
Figures 17-20: Consumer Wealth Effect & Components y/y
Source: Optimal Advisory Analysis, Bloomberg, Zillow, Redfin
Median Home Price y/y, S&P 500 y/y, & Wealth Effect Index (Since 2022)
Source: Optimal Advisory Analysis, Bloomberg, Zillow, Redfin
Figures 21-22: Optimal Advisory Multifactor Macro Market Model
Historical Test Predictions vs. Actual (On Test Data Only)
Source: Optimal Advisory Proprietary Analysis, Bloomberg, FRED, BLS, BEA, OECD, University of Michigan Consumer Sentiment Survey, U.S. Census Bureau, FRB
Actual & Projected S&P 500 (Including Training & Test Data) with Confidence Intervals
Source: Optimal Advisory Proprietary Analysis, Bloomberg, FRED, BLS, BEA, OECD, University of Michigan Consumer Sentiment Survey, U.S. Census Bureau, FRB
Figure 23: Index & Sector Performance
Source: Optimal Advisory Analysis, Bloomberg, prices intraday 2/9/2026