Gen Z Winners & Losers: March Analysis across 113 Companies (Retailers, Brands, Travel, Transport)
In this updated report, we analyze both mix of Gen Z engagement and inflection of Gen Z traction with this key 18-34 year-old consumer cohort – this demographic continues to take share of spending within the economy and change how retailers/brands interact with customers. We calculate and examine these trends both across and within subsectors. Callouts include BOOT, SHAK, BYD; large caps of note WMT, TGT, GAP, URBN (see 14 page attached report):
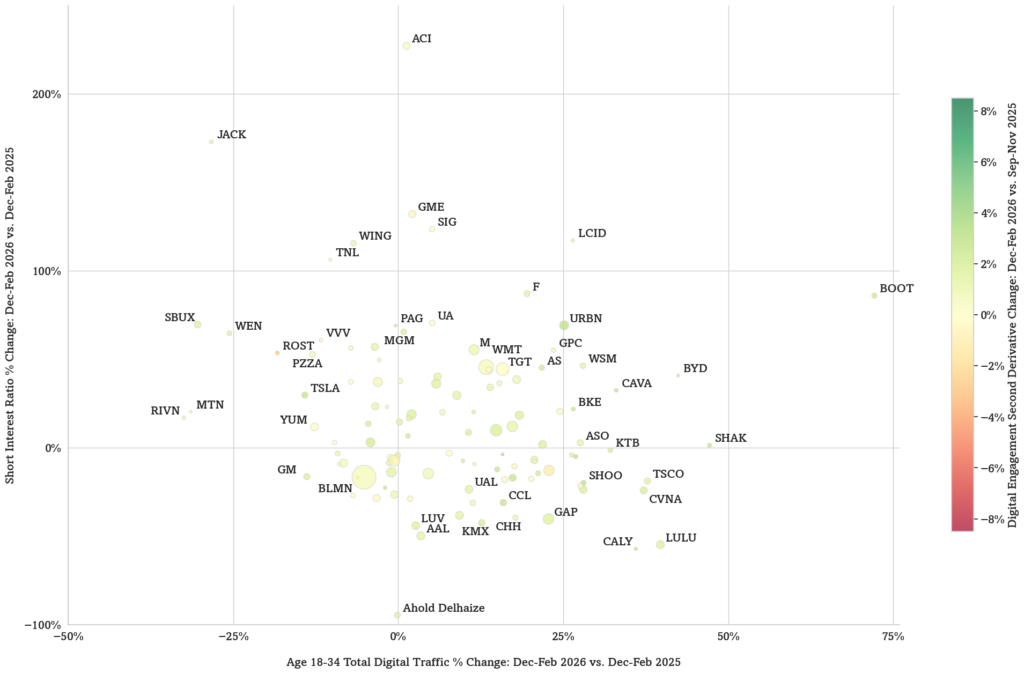
BOOT, SHAK, BYD lead all measured names in Gen Z traction growth (we note BOOT also has a substantial increase in short interest). Our analysis also shows JACK, WING, TNL among brands with jumps in short interest and declines in Gen Z traction (see Figure 1).
Large caps with notable Gen Z growth include WMT, TGT, GAP, URBN.
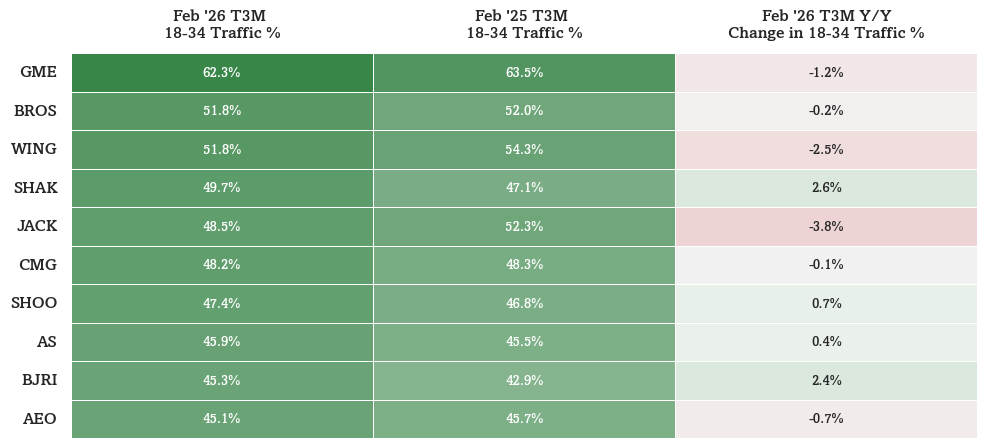
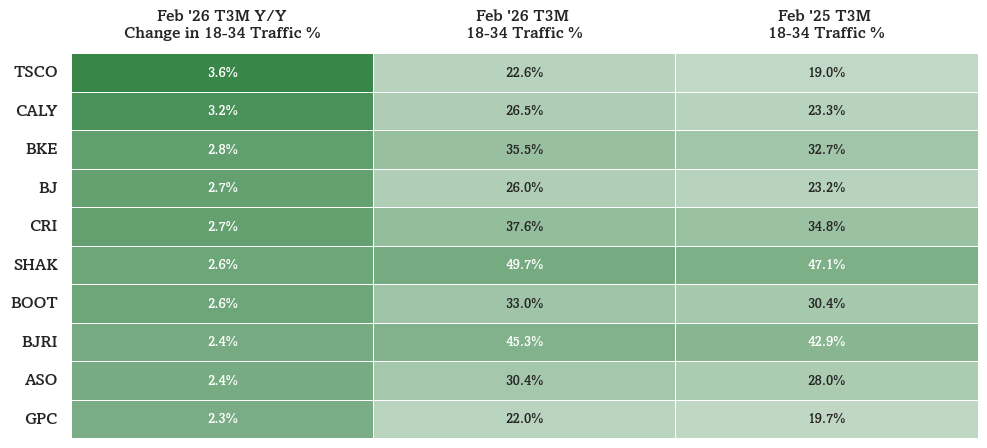
GME, BROS, WING have the highest mix of traction with 18-34 yo, though all three with negative inflections while SHAK, BJRI inflecting positively (See Figure 2). TSCO, CALY, BKE have the strongest growth in traction with 18-34 yo (see Figure 3).
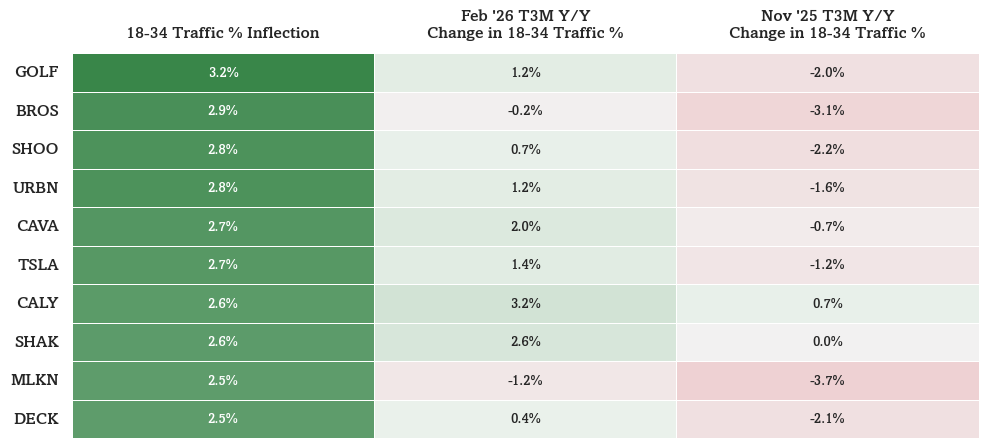
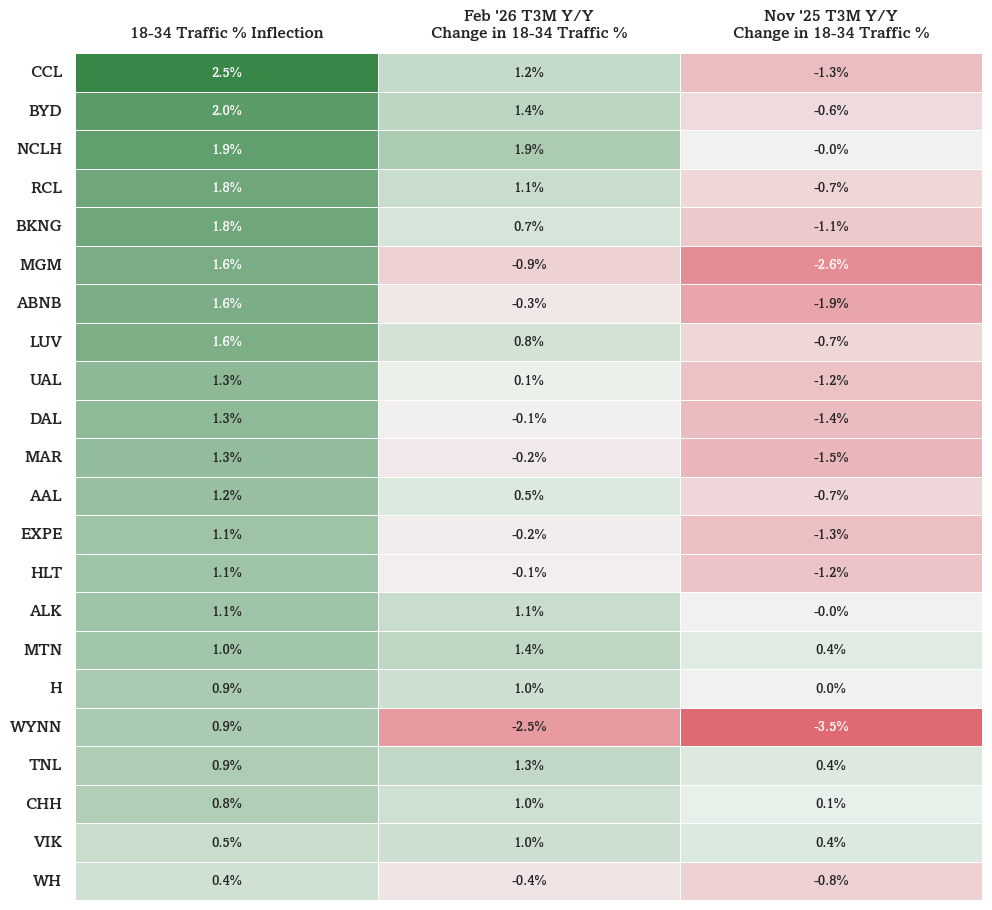
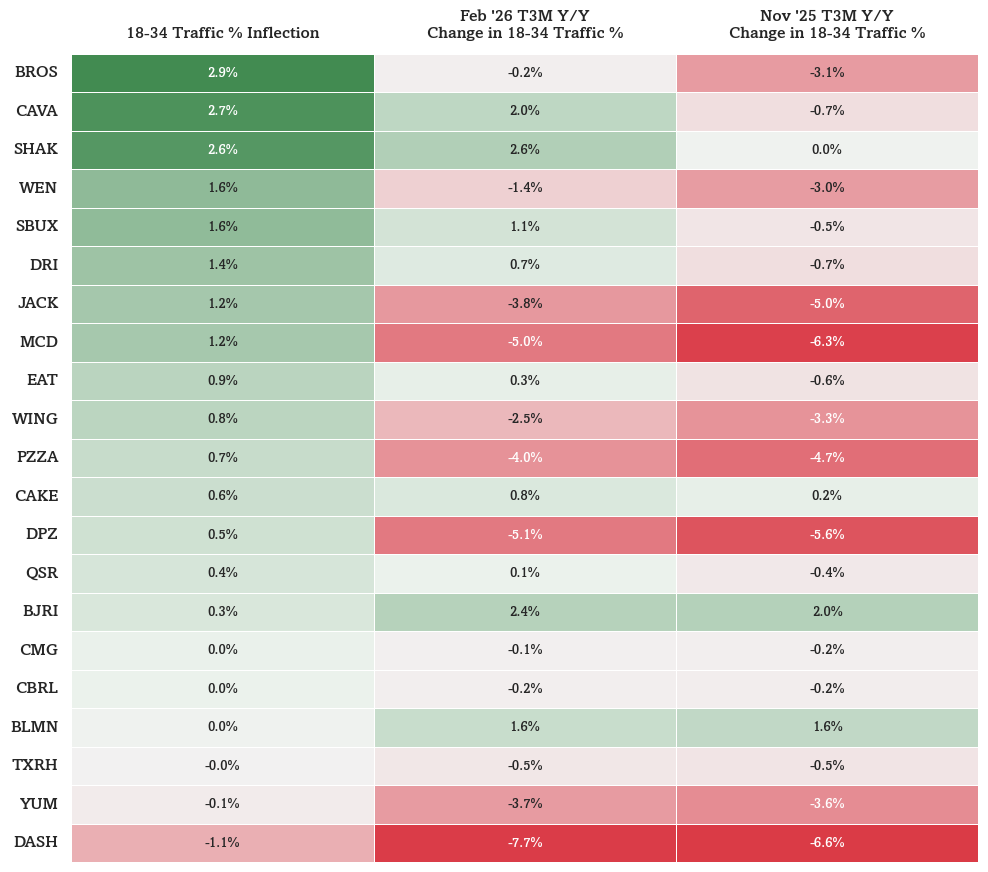
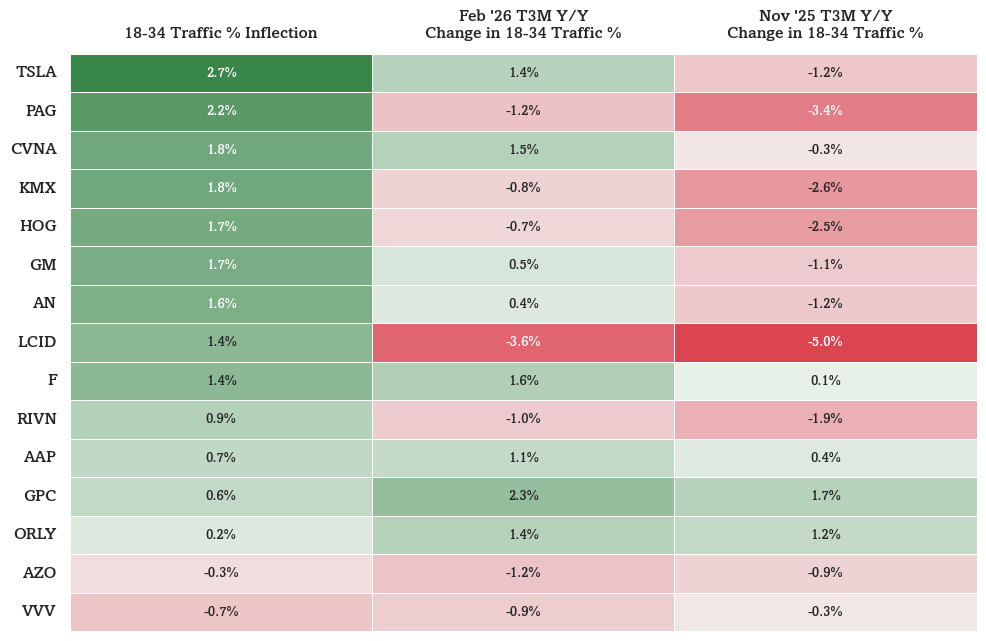
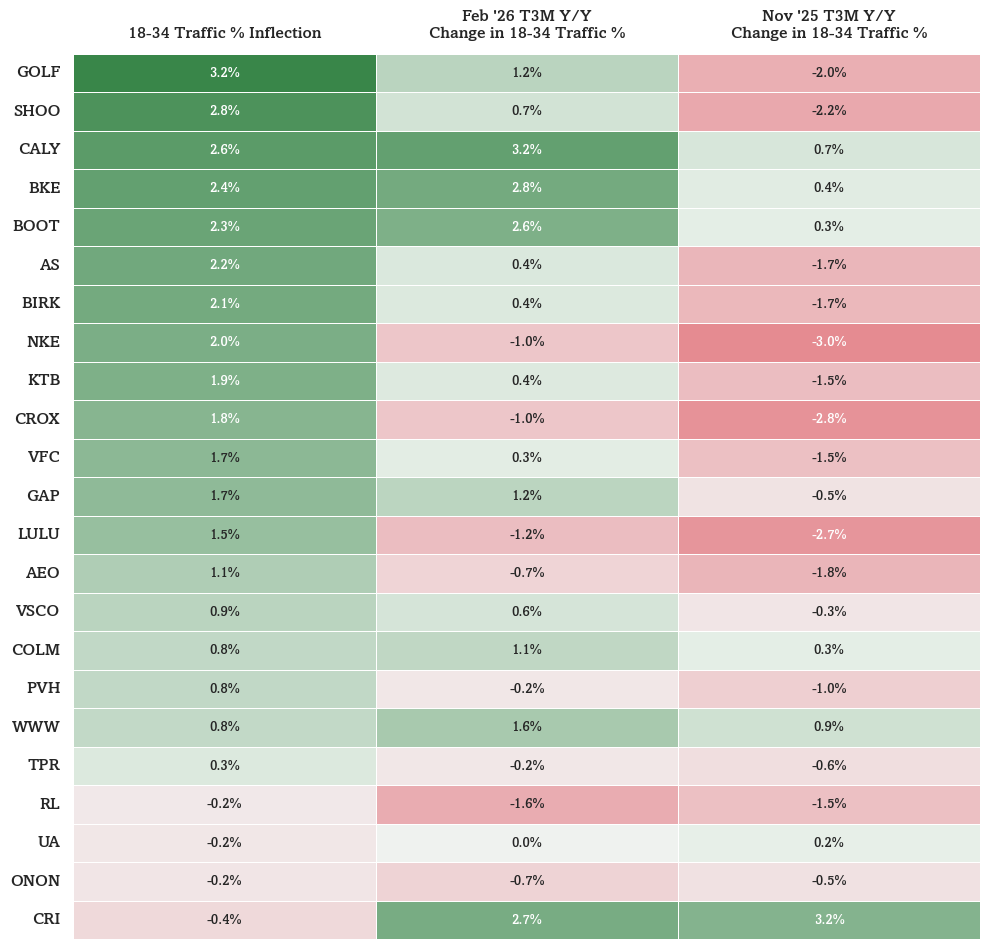
GOLF, BROS, SHOO have shown positive inflection from Nov-Jan 2026 relative to prior trend (see Figure 4). CCL, BYD, NCLH lead leisure, accommodation, & travel companies in inflections (see Figure 5) while BROS, CAVA, SHAK lead restaurant brands (see Figure 7), TSLA, PAG, CVNA lead automotive brands (see Figure 9), GOLF, SHOO, CALY lead apparel & golf brands (see Figure 11), and URBN, MLKN, DECK lead retail brands (see Figure 13).
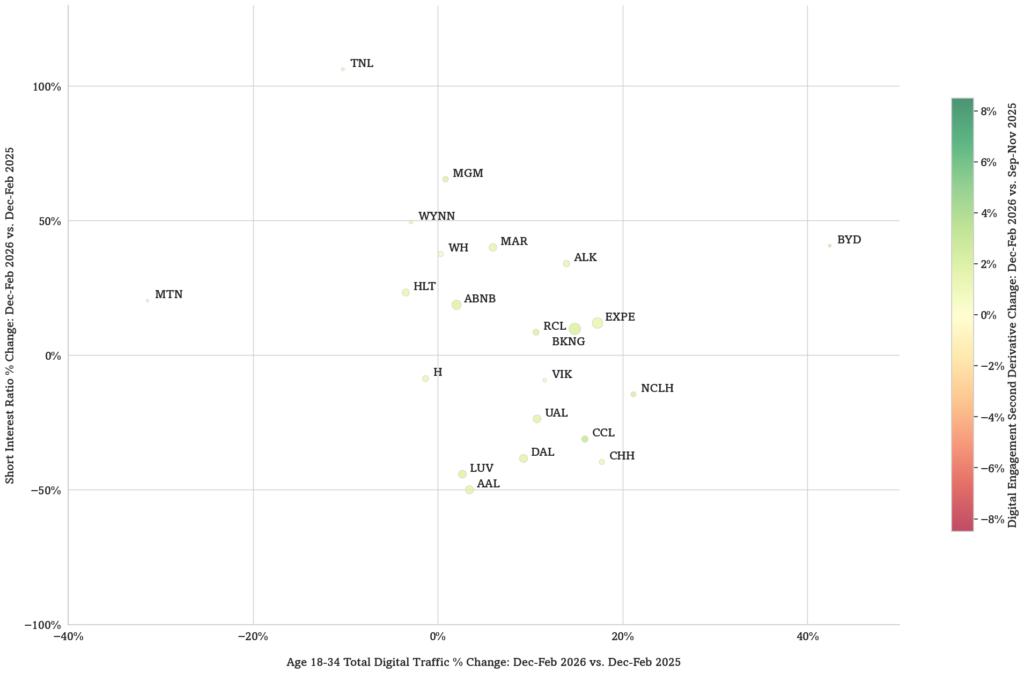
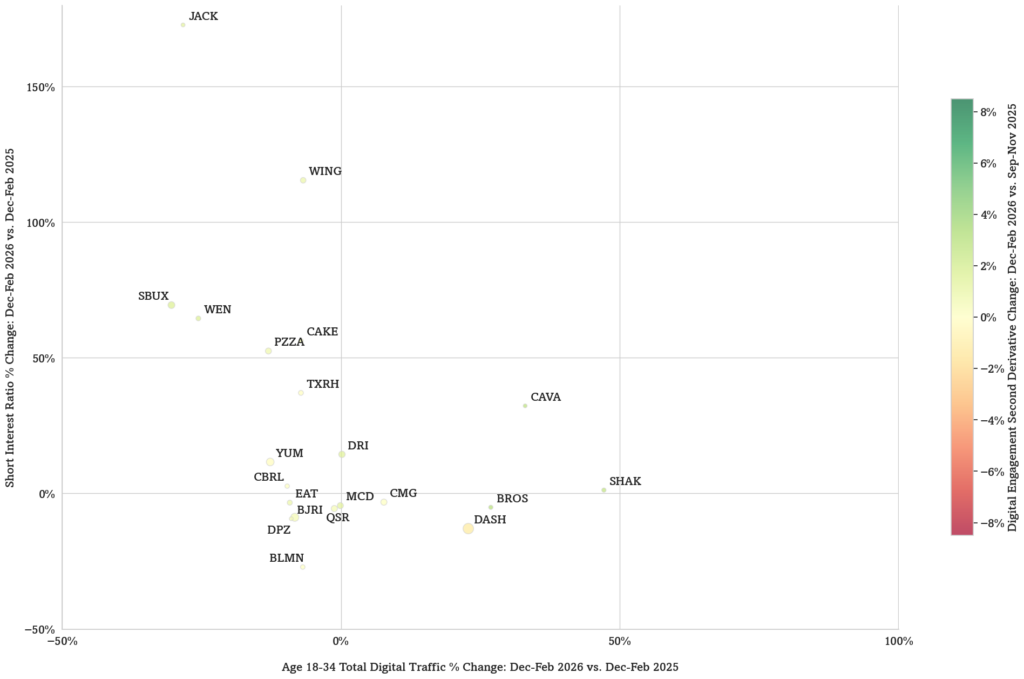
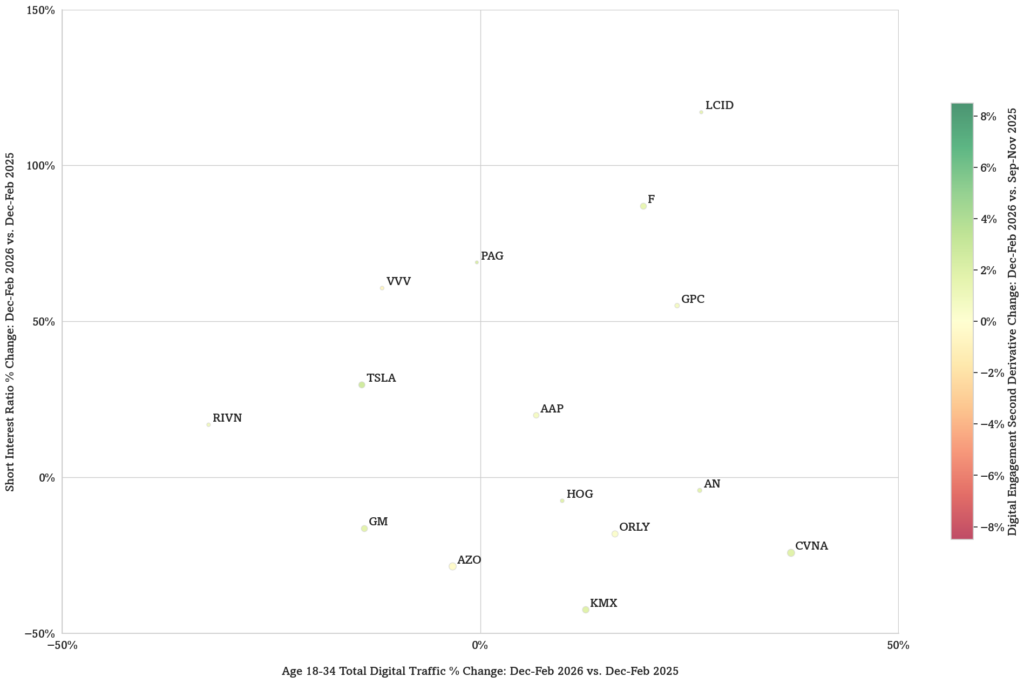
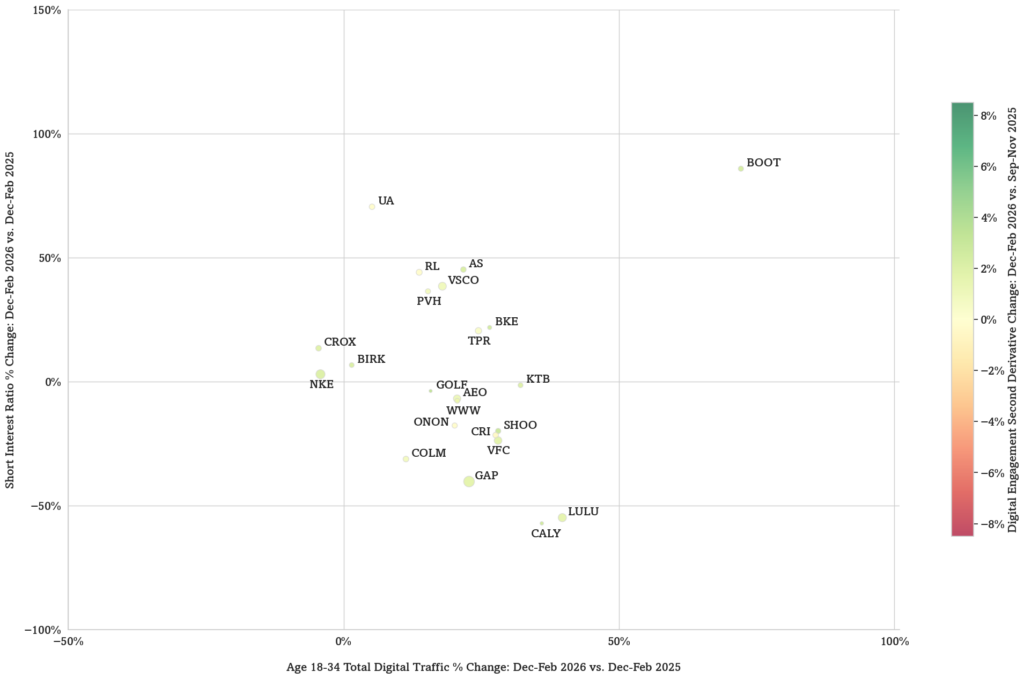
BYD, NCLH, CHH lead leisure, accommodation, & travel companies in year-over-year Gen Z engagement growth (see Figure 6). SHAK, CAVA, BROS lead within restaurants (see Figure 8). CVNA, AN, LCID lead automotive brands (Figure 10). BOOT, LULU, CALY lead apparel & golf brands (see Figure 12). TSCO, WSM, ASO lead retail brands (see Figure 14).
Figure 1: Change in Short Interest Ratio vs. Change in 18-34 Digital Traffic Y/Y
Source: Optimal Advisory analysis, Similarweb, Bloomberg
Figure 2: Age 18-34 Top 10
Source: Optimal Advisory analysis, Similarweb
Figure 3: Age 18-34 Top 10 Y/Y Change
Source: Optimal Advisory analysis, Similarweb
Figure 4: Age 18-34 Top 10 Inflections
Source: Optimal Advisory analysis, Similarweb
Figure 5: Age 18-34 Leisure, Accommodations, & Travel Inflections
Source: Optimal Advisory analysis, Similarweb
Figure 6: Leisure, Accommodations, & Travel Change in Short Interest Ratio vs. Change in 18-34 Digital Traffic Y/Y
Source: Optimal Advisory analysis, Similarweb, Bloomberg
Figure 7: Age 18-34 Restaurant Inflections
Source: Optimal Advisory analysis, Similarweb
Figure 8: Restaurants Change in Short Interest Ratio vs. Change in 18-34 Digital Traffic Y/Y
Source: Optimal Advisory analysis, Similarweb, Bloomberg
Figure 9: Age 18-34 Automotive Inflections
Source: Optimal Advisory analysis, Similarweb
Figure 10: Automotive Change in Short Interest Ratio vs. Change in 18-34 Digital Traffic Y/Y
Source: Optimal Advisory analysis, Similarweb, Bloomberg
Figure 11: Age 18-34 Apparel & Golf Inflections
Source: Optimal Advisory analysis, Similarweb
Figure 12: Apparel & Golf Change in Short Interest Ratio vs. Change in 18-34 Digital Traffic Y/Y
Source: Optimal Advisory analysis, Similarweb, Bloomberg
Figure 13: Age 18-34 Retail Inflections
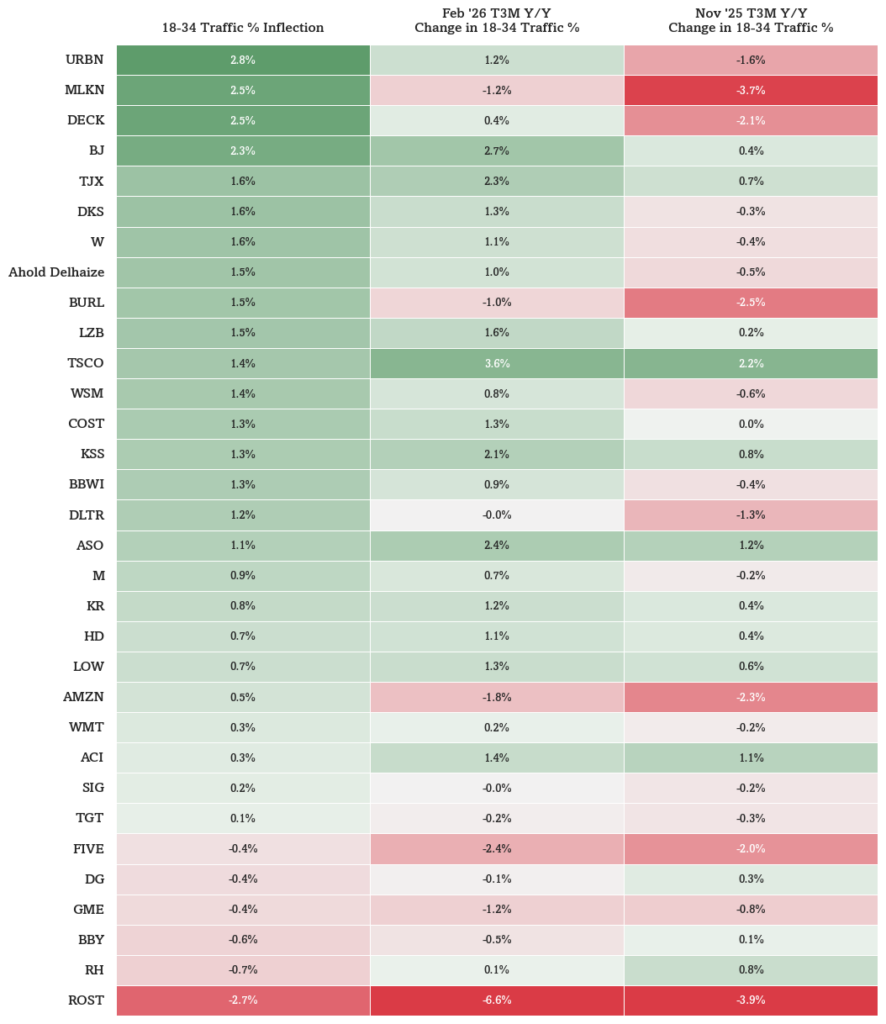
Source: Optimal Advisory analysis, Similarweb
Figure 14: Retail Change in Short Interest Ratio vs. Change in 18-34 Digital Traffic Y/Y
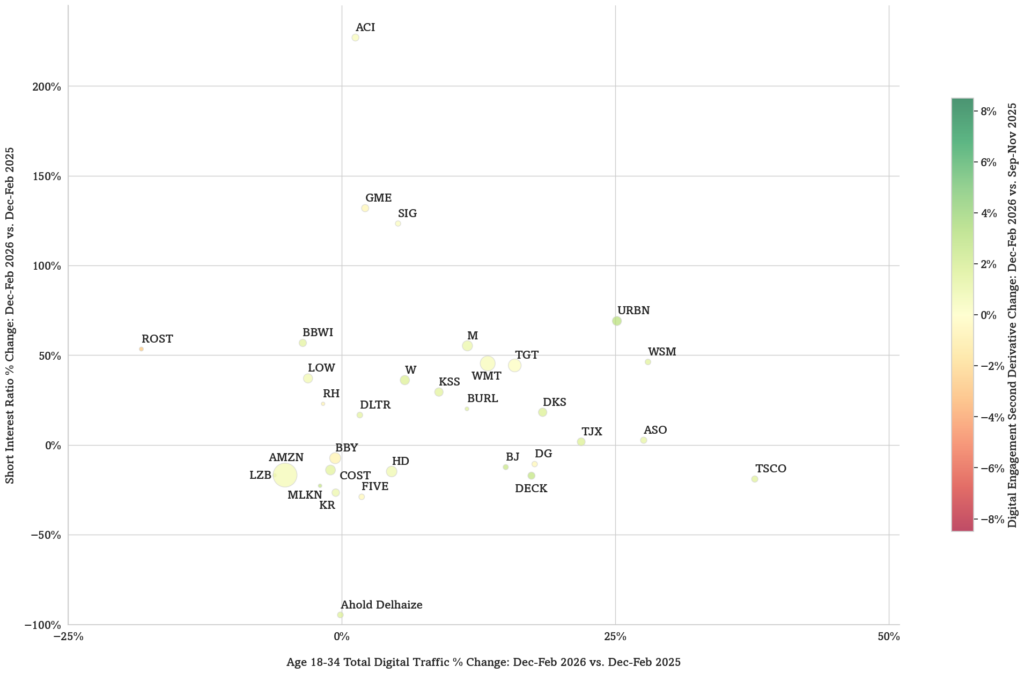
Source: Optimal Advisory analysis, Similarweb, Bloomberg