MSGE (+) In Five; LULU (–); NKE Digital Traction Change Globally and in US; Our NFL Call Tomorrow: The Optimal Sports Section
Summary: (1) Optimal’s Sports Ecosystem revenue tracker remained negative at -0.8% T8W y/y; (2) Sports equity indices underperformed the broader market this week; (3) MSGE spending and digital traffic both inflected sharply higher in tandem with the Knicks playoff run, while LULU spending and foot traffic are both negative and inflecting further negatively; (4) NKE’s US and global digital traffic both continued to inflect positively; (5) Every Day is Sunday: How Jerry Jones, Robert Kraft, and Roger Goodell Turned the NFL into a Cultural & Economic Juggernaut with Ken Belson, Author and New York Times Journalist on Thursday, June 18th at 10:30 AM ET – Register for Virtual Meeting.
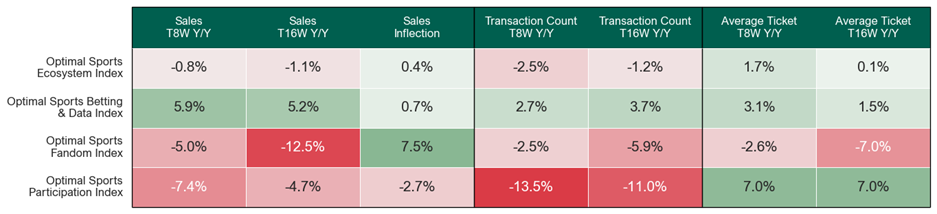
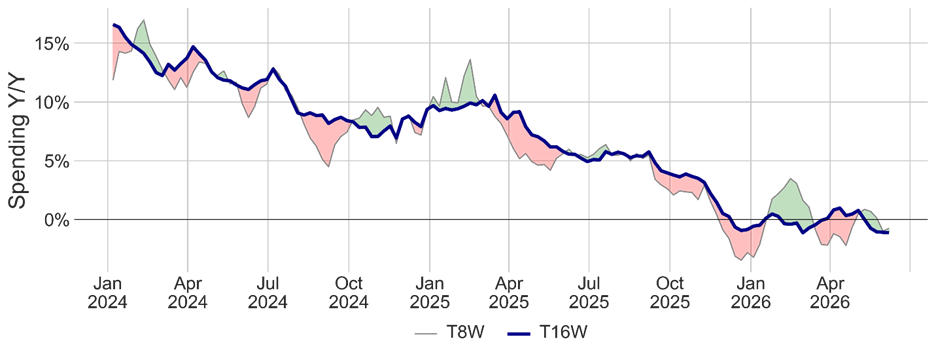
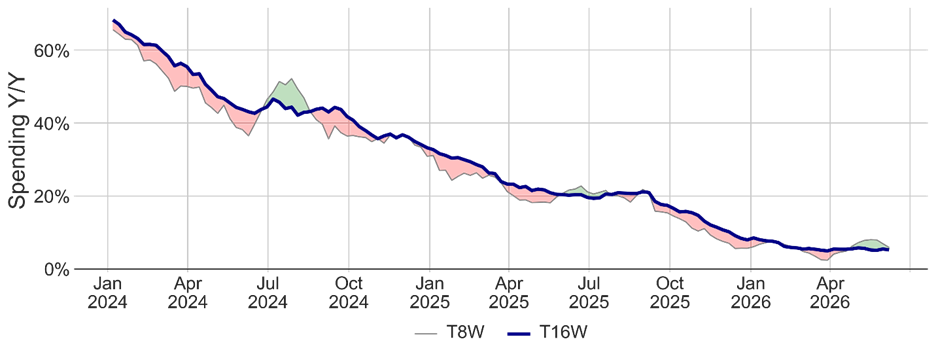
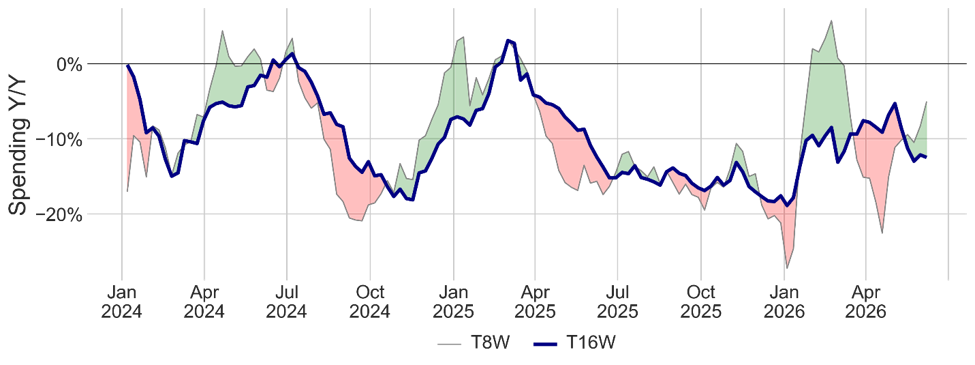
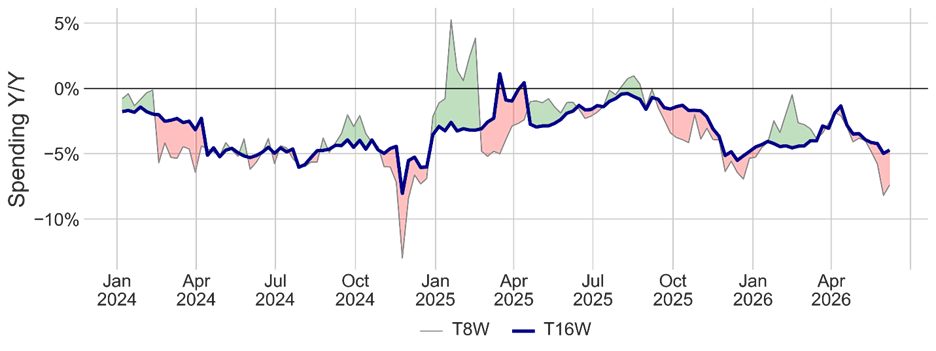
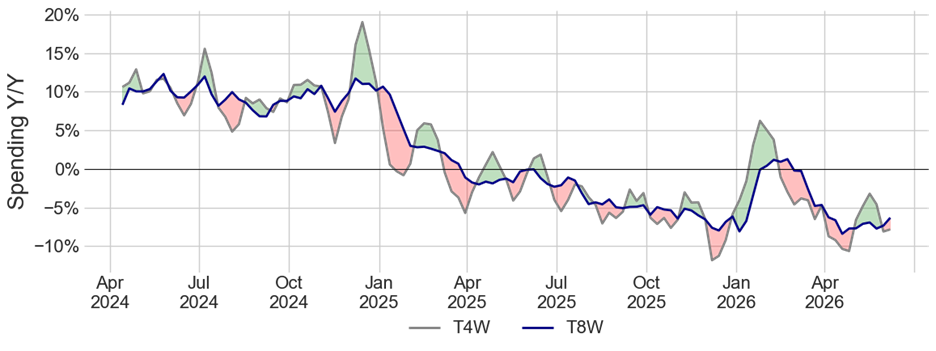
- The Optimal Sports Ecosystem Index revenue tracker improved modestly to -0.8% T8W y/y vs. -1.1% T16W (from -1.0% last week). Sports Betting & Data spending decelerated to +5.9% T8W y/y from +6.9% last week (vs. +5.2% T16W) but remained the strongest sub-index. Sports Fandom spending improved meaningfully to -5.0% T8W y/y on -2.5% transactions and -2.6% ticket, vs. -8.3% last week. Sports Participation spending also improved modestly to -7.4% T8W y/y (vs. -8.3% last week) on a -13.5% drop in transactions, partially offset by a +7.0% ticket increase. Experiences & Entertainment spending remains sharply down y/y but has inflected slightly upwards from recent lows on a longer-term basis.
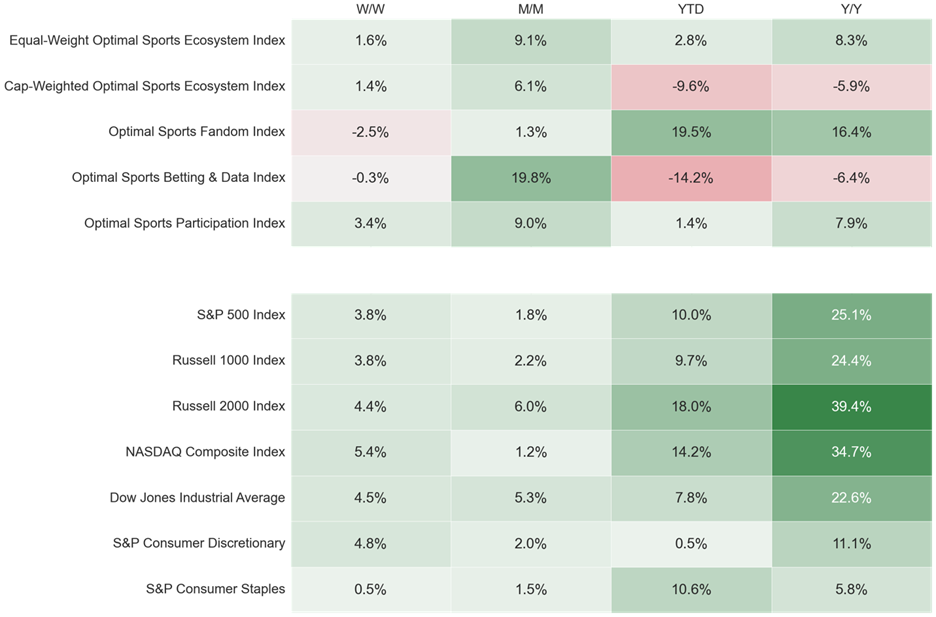
- Sports equity indices underperformed the broader market this week. The Equal-Weight Optimal Sports Ecosystem Index (+1.6% w/w) and the Cap-Weighted Optimal Sports Ecosystem Index (+1.4% w/w) both underperformed the S&P 500 (+3.8% w/w). Optimal’s Sports Participation Index (+3.4% w/w) was the strongest sub-index but still underperformed the broader market, while the Sports Betting & Data Index (-0.3% w/w) and Sports Fandom Index (-2.5% w/w) both underperformed and were negative w/w.
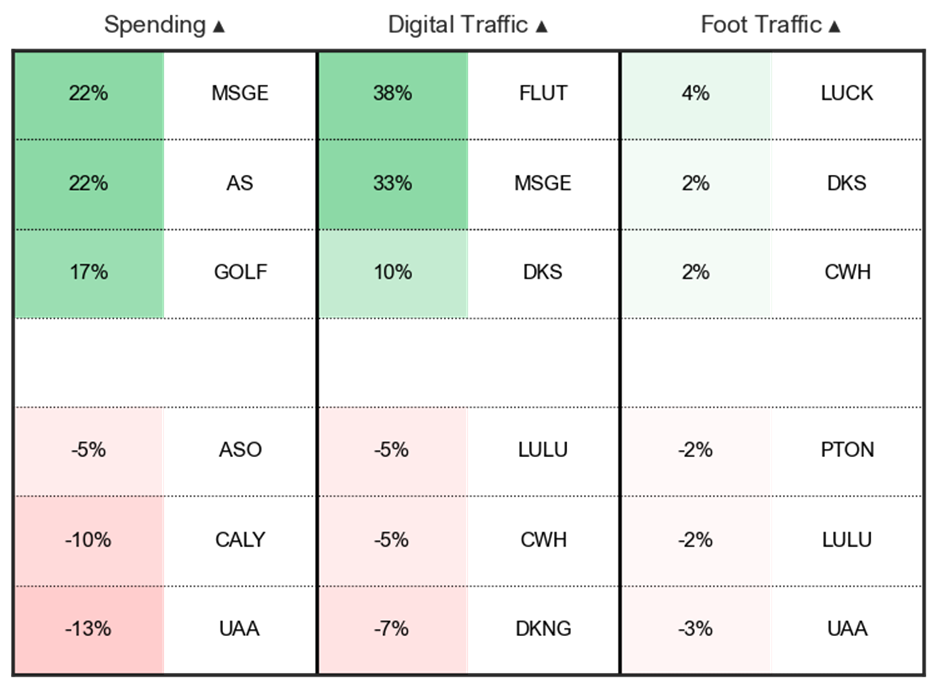
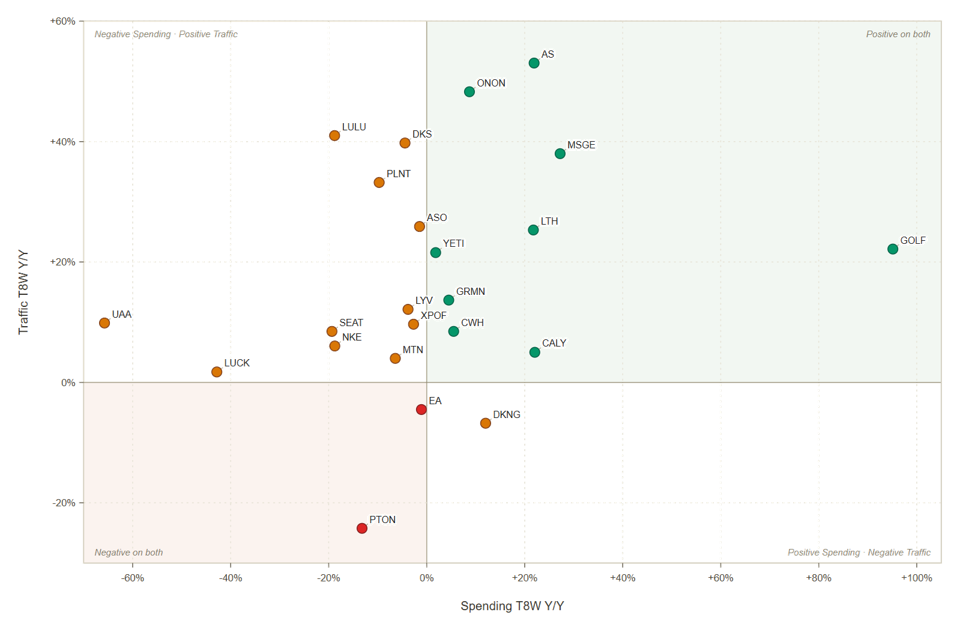
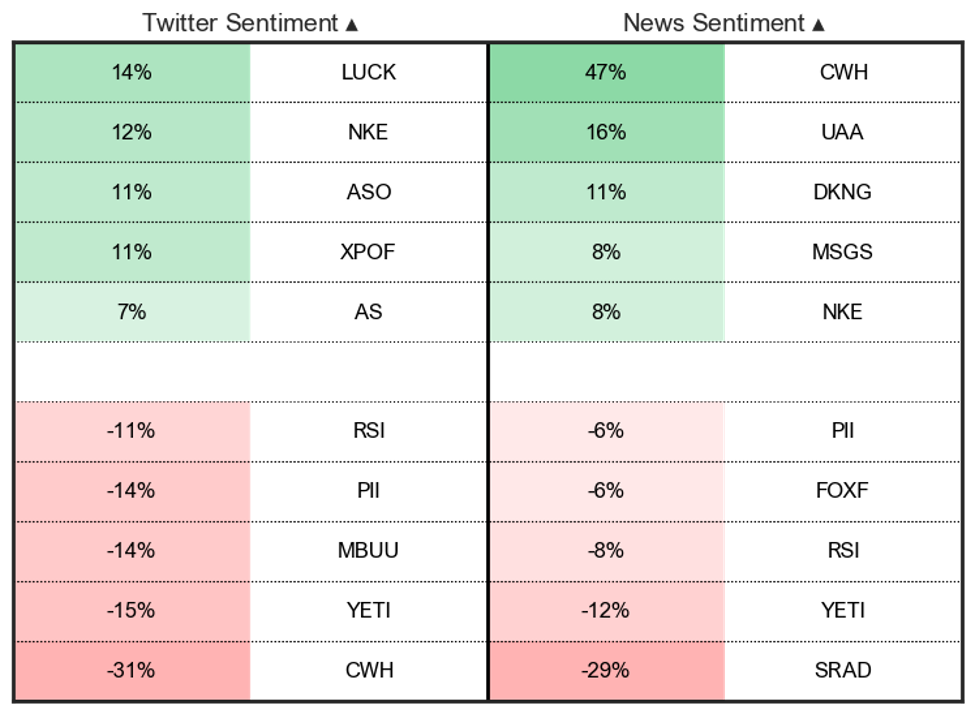
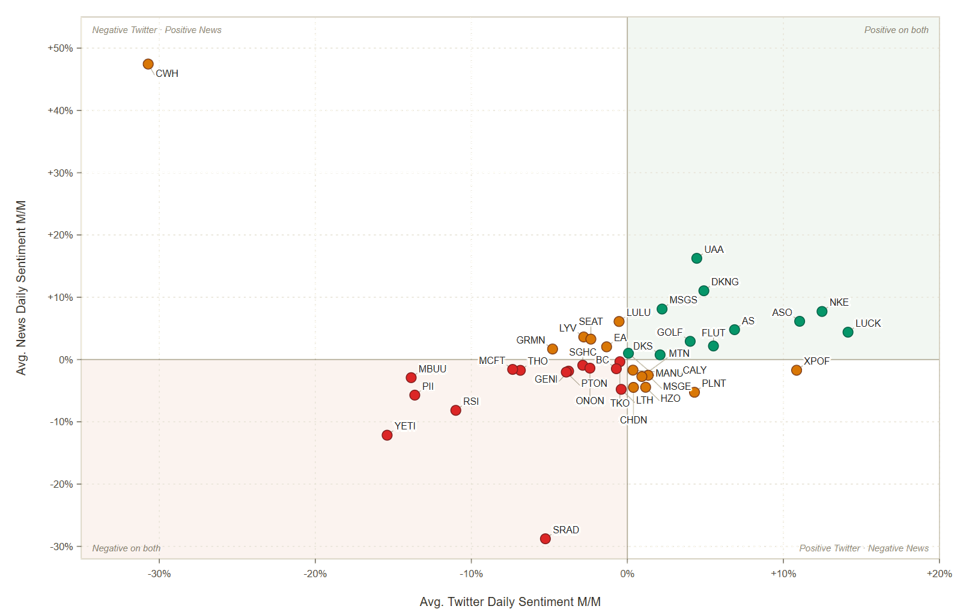
- MSGE (+): In tandem with the Knicks playoff run, spending (+27.2% T8W y/y) accelerated sharply and inflected positively (+22.4% relative to longer-term trend), with digital traffic also up sharply (+38.0% T8W y/y) and inflecting positively (+33.0% relative to longer-term trend), both among the largest positive inflections across the coverage universe. Foot traffic is roughly stable (-2.6% T8W y/y, +0.5% inflection). Monthly Sentiment is mixed, with Twitter Sentiment up +1.3% m/m and news Sentiment down -2.5% m/m.
- LULU (–): Spending is down -18.8% T8W y/y and inflecting further negatively (-2.9% relative to longer-term trend). Foot traffic is also negative (-5.4% T8W y/y) and inflecting further negatively (-1.8% relative to longer-term trend). Digital traffic growth remains strong in absolute terms (+41.0% T8W y/y) but it is decelerating (-5.0% inflection). News sentiment was up +6.1% m/m, while Twitter sentiment was roughly flat (-0.5% m/m).
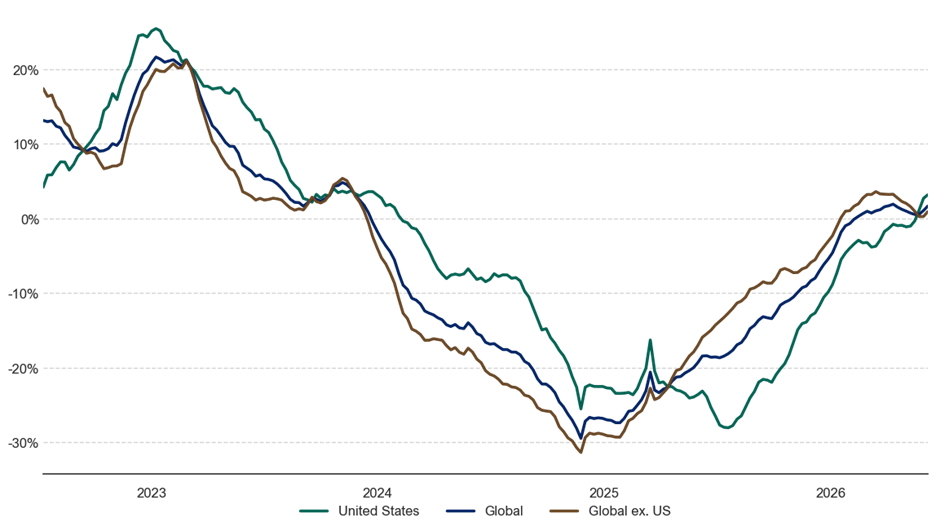
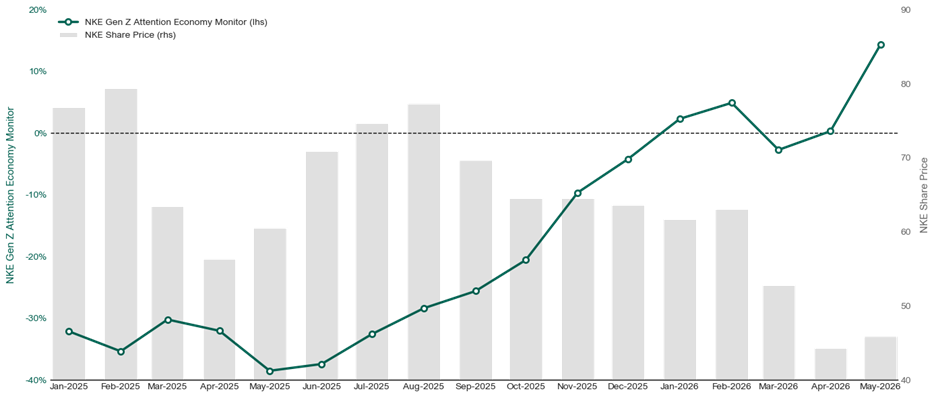
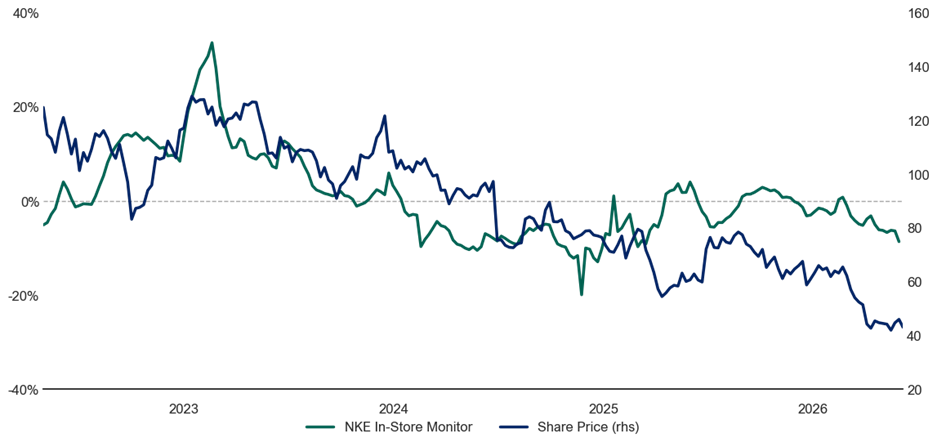
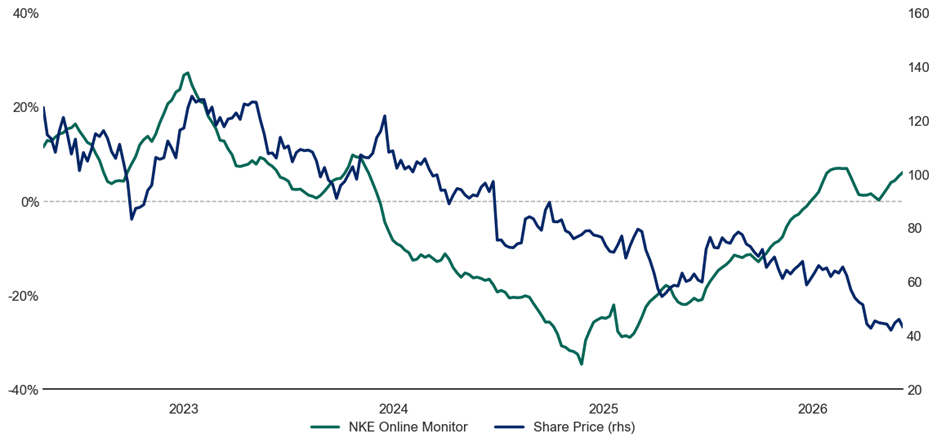
- Weekly NKE Analysis: US digital traffic continued to inflect positively (+3.2% T16W y/y in the most recent week, up from +2.7% last week and -3.7% in mid-March), while global digital traffic continues to accelerate as well (+1.7% T16W y/y vs. +1.1% last week). Optimal’s Online Monitor accelerated further to +6.0% (continuing to reach recent highs), though the In-Store Monitor decelerated to -8.7% in the most recent reading (its lowest value since March 2025). NKE’s Gen Z Attention Economy Monitor reached +14.4% in May (up from +0.3% in April), reflecting strong Gen Z engagement. Monthly sentiment also turned strongly positive, with Twitter sentiment up +12.5% m/m and news sentiment up +7.7% m/m.
Headlines
- Headline: Fox Sports passed 1 billion views for World Cup content across its digital and social platforms in the first five days of the tournament, well ahead of expectations and on pace to break Fox’s all-time event record of 1.3 billion views set by the 2025 World Series.
- Headline: The WNBA is expanding its 2027 regular-season schedule to 50 games, up from 44, marking the most games in league history and coinciding with the league’s ongoing expansion to 18 teams by 2030; CNBC will also simulcast 11 WNBA games this season alongside USA Network.
- Headline: Deep Blue Sports + Entertainment and Mondo Metrics are partnering to launch the Women’s Sports Index, a digital platform providing real-time social media benchmarking and media value measurement for women’s sports leagues, teams, and athletes across TikTok, Instagram, YouTube, and Facebook.
Game of the Week:
- USA vs. Australia (June 19th, 2026 @ 7:00 PM EST): After the US’s commanding 4-1 win against Paraguay and Australia’s 2-0 upset win against Türkiye, the two teams will face off with the chance to take a commanding lead in Group D.
Optimal Sports Ecosystem & Sectors Analysis
Optimal Sports Ecosystem Revenue Trackers
Source: Optimal Advisory Analysis, Bloomberg Second Measure
Optimal Sports Ecosystem Index Revenue Tracker
Source: Optimal Advisory Analysis, Bloomberg Second Measure
Optimal Sports Betting & Data Index Revenue Tracker
Source: Optimal Advisory Analysis, Bloomberg Second Measure
Optimal Sports Fandom Index Revenue Tracker
Source: Optimal Advisory Analysis, Bloomberg Second Measure
Optimal Sports Participation Index Revenue Tracker
Source: Optimal Advisory Analysis, Bloomberg Second Measure
Optimal Sports Entertainment and Experiences Revenue Tracker
Source: Optimal Advisory Analysis, Bloomberg Second Measure
Spending, Digital Traffic, & Foot Traffic Inflections (T8W vs. T16W)
Source: Optimal Advisory Analysis, Bloomberg Second Measure, Similarweb, Placer.ai
Online Traffic vs. Card Spending Growth
Source: Optimal Advisory Analysis, Bloomberg Second Measure, Similarweb
Top Twitter & News Sentiment Monthly Gainers and Declines
Source: Optimal Advisory Analysis, Bloomberg
Twitter Sentiment vs. News Sentiment Monthly Change
Source: Optimal Advisory Analysis, Bloomberg
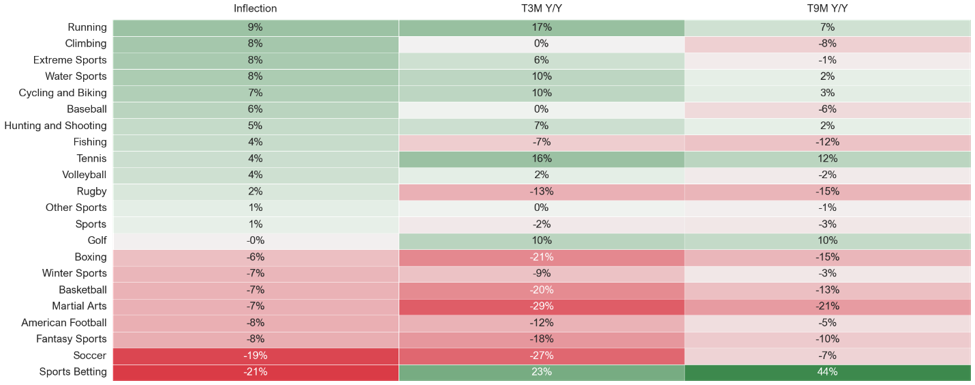
Sports Category Digital Inflections
Source: Optimal Advisory Analysis, Similarweb
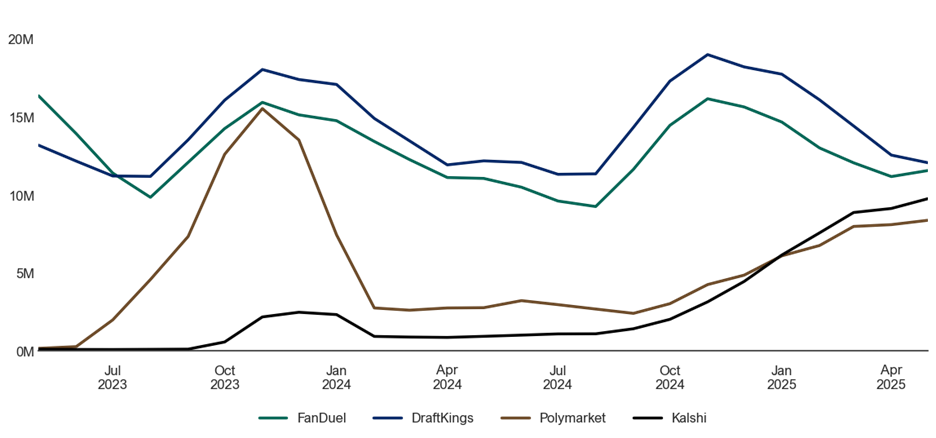
Sports Betting vs. Prediction Market Attention Economy Monitor
Source: Optimal Advisory Analysis, Similarweb
NKE Trends Weekly Analysis
NKE Attention Economy trends are slightly positive y/y globally and are increasingly positive y/y in the US (+3% y/y T16W).
NKE International Global Attention Economy Trends (T16W Y/Y)
Source: Optimal Advisory Analysis, Bloomberg, Similarweb
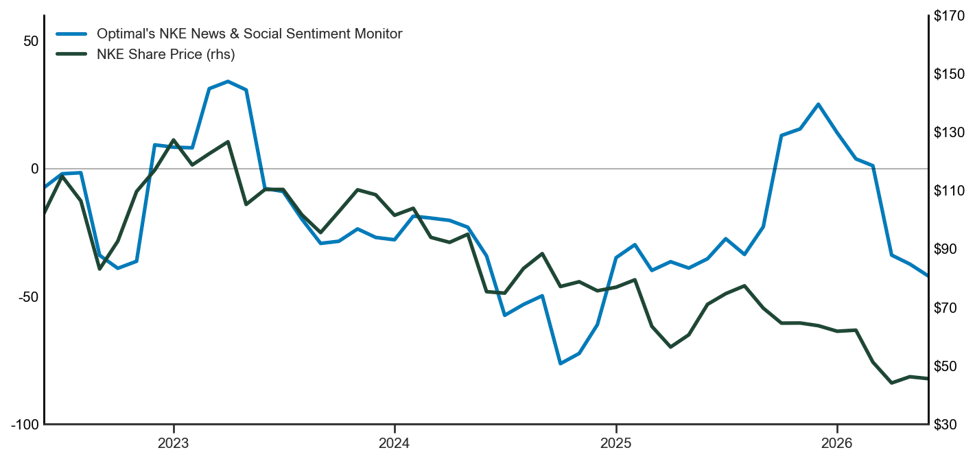
Our Gen Z Attention Economy Monitor, which tracks how Gen Z consumers engage digitally with individual brands, improved for NKE in January (+2% y/y) and February (+5% y/y), declined slightly in March (-3%), and was flat in April, but has increased by +14% y/y in May, signaling greatly improving Gen Z Attention Economy trends. Optimal’s News & Social Sentiment Monitor is lower than late 2025 after moving sharply lower following NKE’s most recent earnings call, but is still higher than late 2024.
Gen Z Attention Economy Monitor
Source: Optimal Advisory Analysis, Similarweb
NKE News & Social Sentiment Monitor
Source: Optimal Advisory Analysis, Bloomberg
Optimal’s In-Store Monitor remains negative y/y but has inflected upwards in recent weeks. Optimal’s Online Monitor has turned positive and continues to accelerate after recently flattening, and is now nearing early 2026 highs.
NKE In-Store Monitor vs. Share Price
Source: Optimal Advisory Analysis, Placer.ai, Bloomberg
NKE Online Monitor vs. Share Price
Source: Optimal Advisory Analysis, Similarweb, Bloomberg
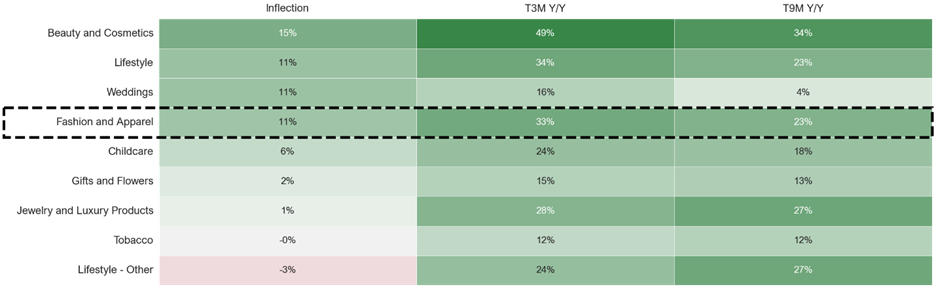
We also note improving online traffic for lifestyle brands broadly and for fashion and apparel brands specifically in May, with traffic both improving and accelerating and inflections also outpacing April numbers (+11% vs. +8%).
Online Traffic to Fashion & Apparel Websites is Improving and Accelerating
Source: Optimal Advisory Analysis, Similarweb
Equity Performance
Index & Sector Performance
Source: Optimal Advisory Analysis, Bloomberg, prices intraday 6/16/2026
Valuation Snapshots
Optimal Sports Betting & Data Index Components Valuation Snapshot
Source: Optimal Advisory Analysis, Bloomberg
Optimal Sports Fandom Index Components Valuation Snapshot
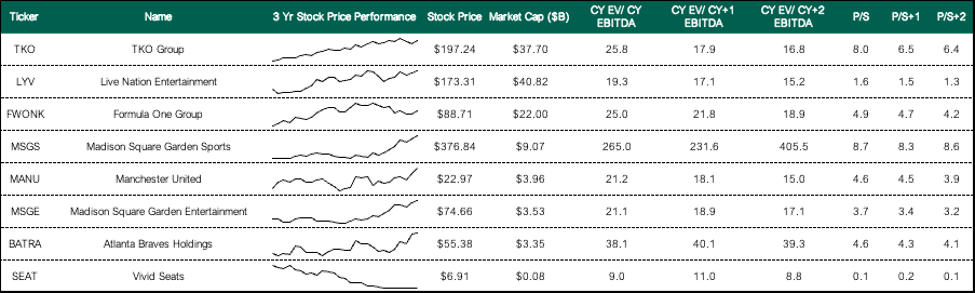
Source: Optimal Advisory Analysis, Bloomberg
Optimal Sports Participation Index Components Valuation Snapshot
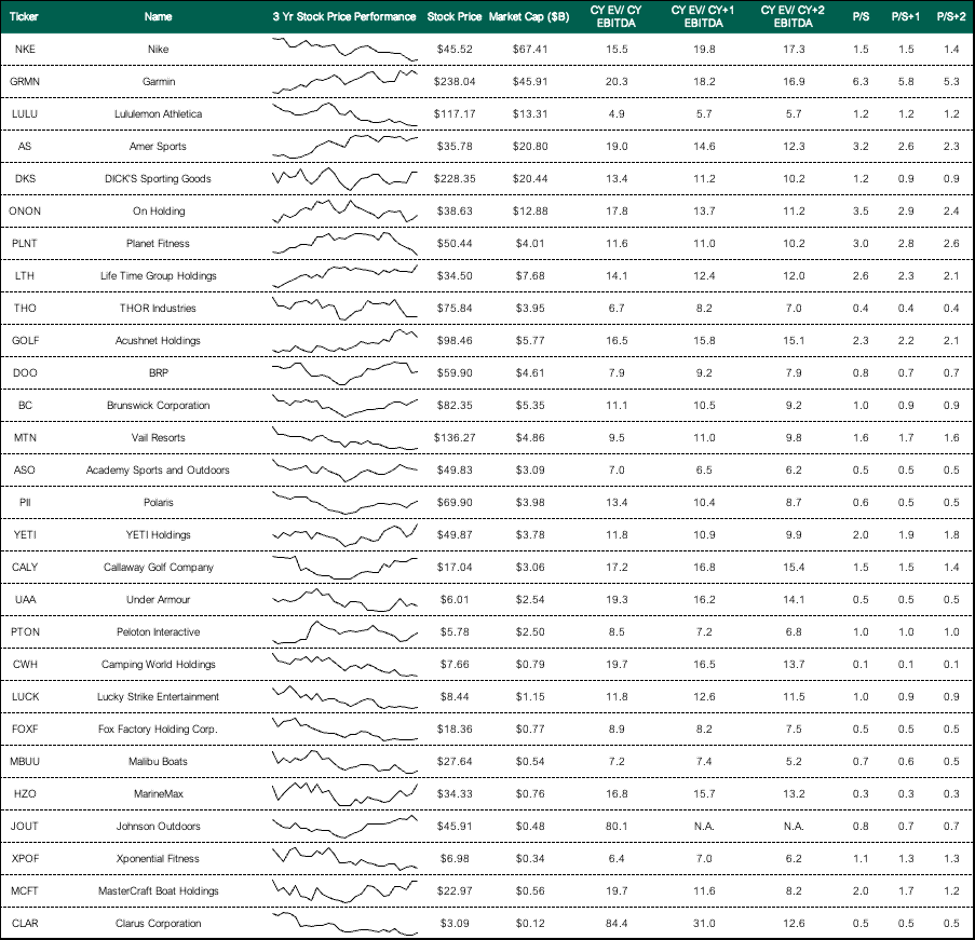
Source: Optimal Advisory Analysis, Bloomberg