AS+, CALY+, LUCK-, GOLF-, GRMN-, Monitoring Declines in Experiences and Entertainment Spending, Weekly NKE Analysis, News of Note, Game of the Week: The Optimal Sports Section
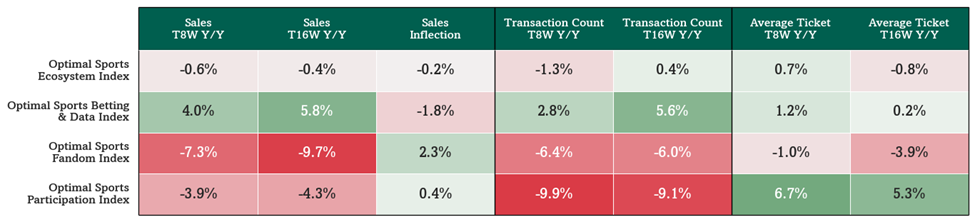
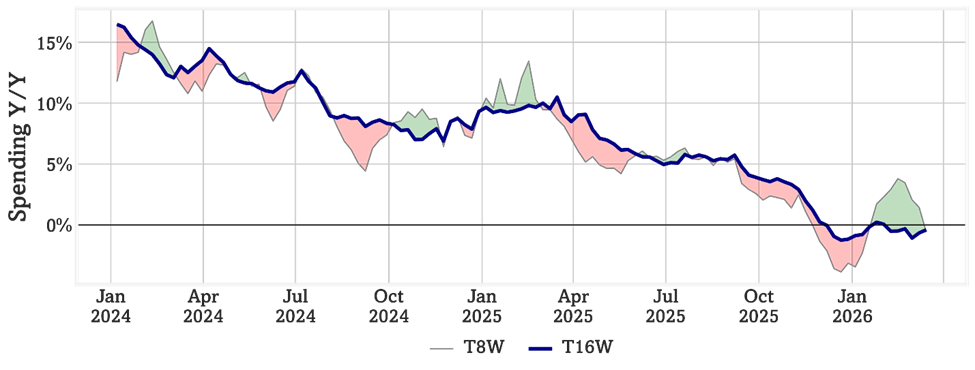
- The Optimal Sports Ecosystem Index revenue tracker’s 8-week trend ran down -0.6% y/y, in line with the 16-week trend. Within that industry, Sports Fandom’s 8-week spending trend is worst at down -7.3% y/y (EA, LYV, MSGE, SEAT all showing double digit y/y spending declines for the week ending 3/15) and Sports Participation spending is down -3.9%, while Sports Betting spending is up +4.0% (thanks NCAA!) and we consider macro variables and the lens into demographic cohort overall spend trend.
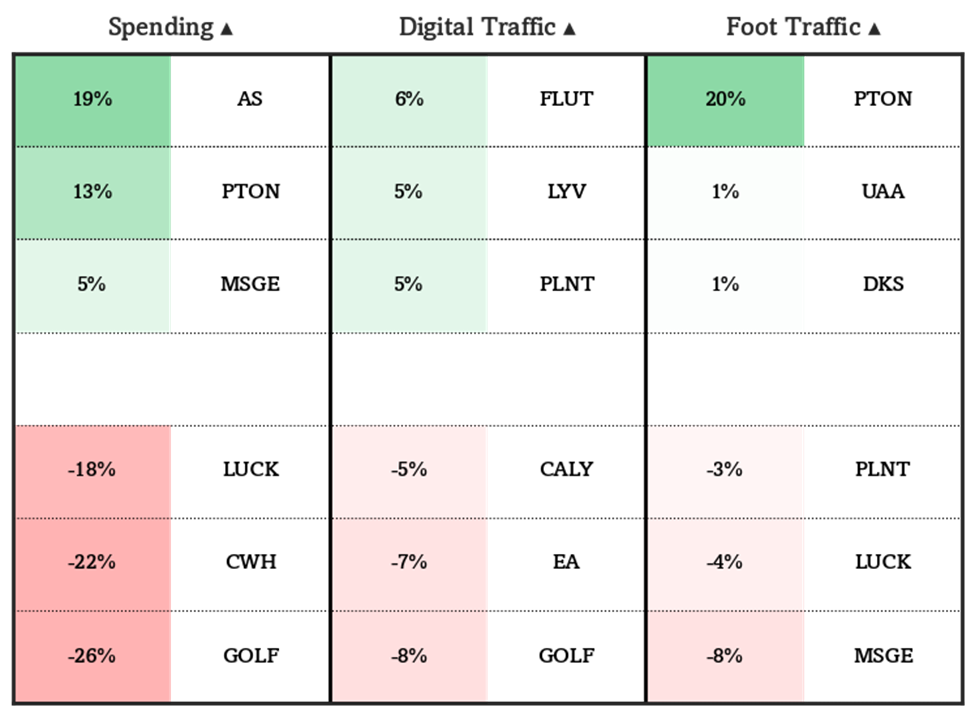
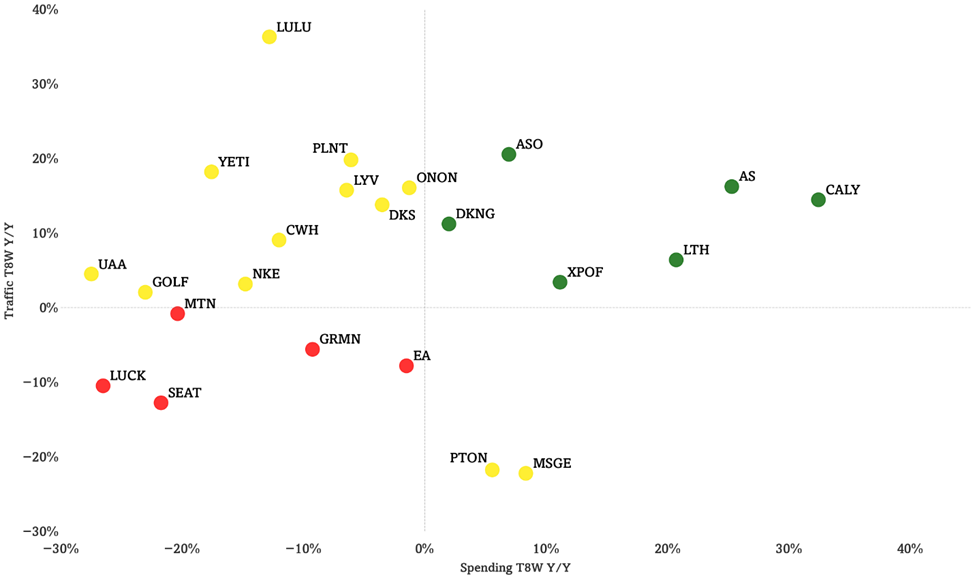
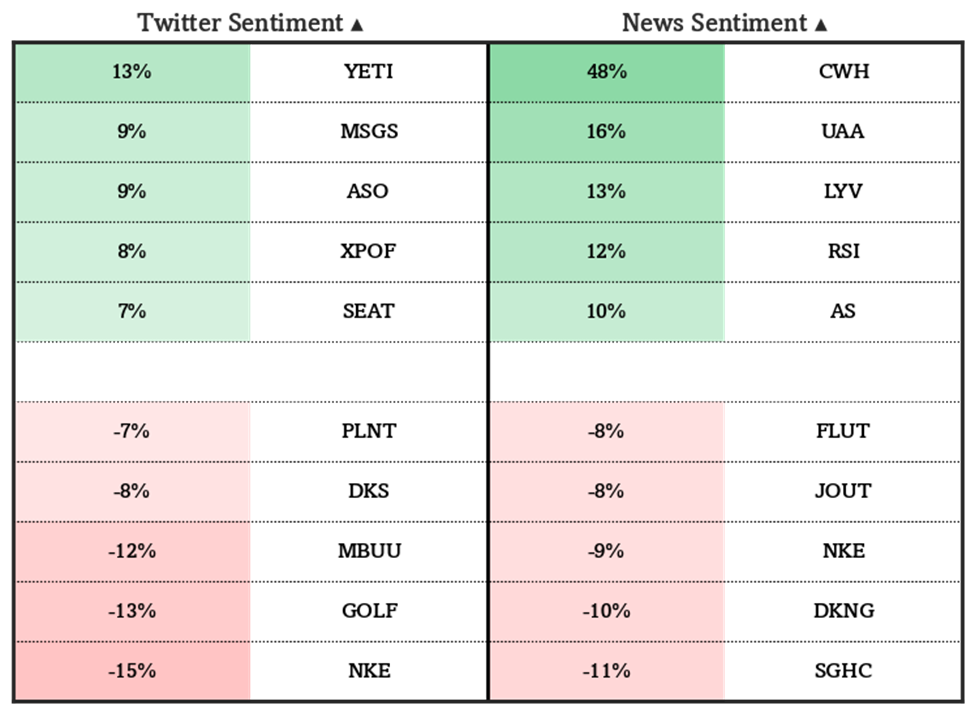
- AS (+): Spending, digital traffic, news sentiment, and Twitter sentiment are all improving, and spending is rapidly accelerating as well.
- CALY (+): Spending growth continues to lead measured brands and digital traffic is up nearly 20% y/y (although we note minor digital traffic decel).
- LUCK (-): Spending is down nearly -30% y/y and digital traffic is down over -10%, with outsized decel in spending and foot traffic.
- GOLF (-): Spending is down -23% y/y and we note bad weather — with T8W trends sharply (-2600 bps) decelerating vs T16W y/y spending, with digital traffic has decel’d by 800 bps over the same timeframe, although we note moderate improvements relative to last week.
- GRMN (-): Spending is down -9% y/y and digital traffic is down -6% y/y.
- Expanding on the Sports Fandom Index’s spending decline, we introduce Optimal’s Entertainment and Experiences revenue tracker and note declines (-4.2% T4W Y/Y) and decel (T4W Y/Y trend is 150 bps below T8W Y/Y trend) in spending on aggregate across the 91 constituent brands (although still above mid-late 2025 levels), which further informs Sports Fandom spending trends.
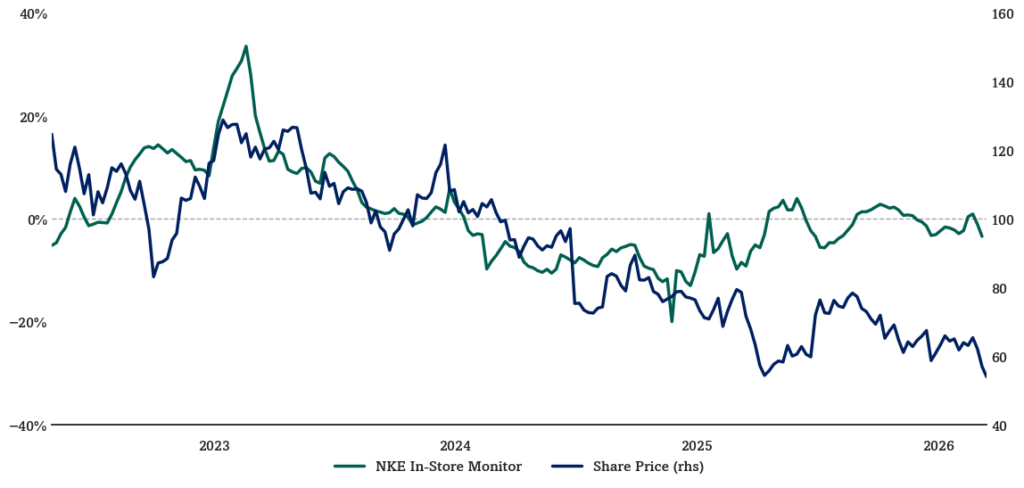
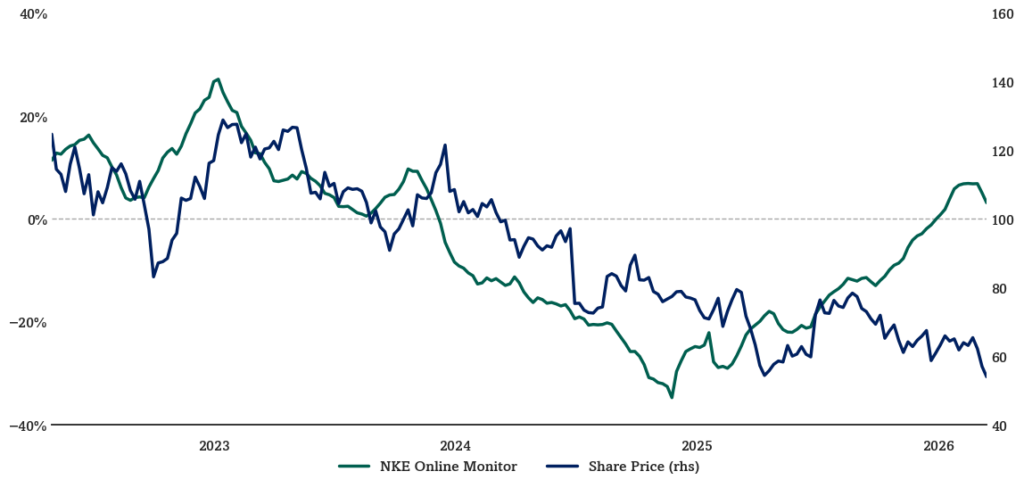
- NKE’s metrics have marginally decelerated in recent weeks but are still outperforming longer-term trends as share price has continued to decline.
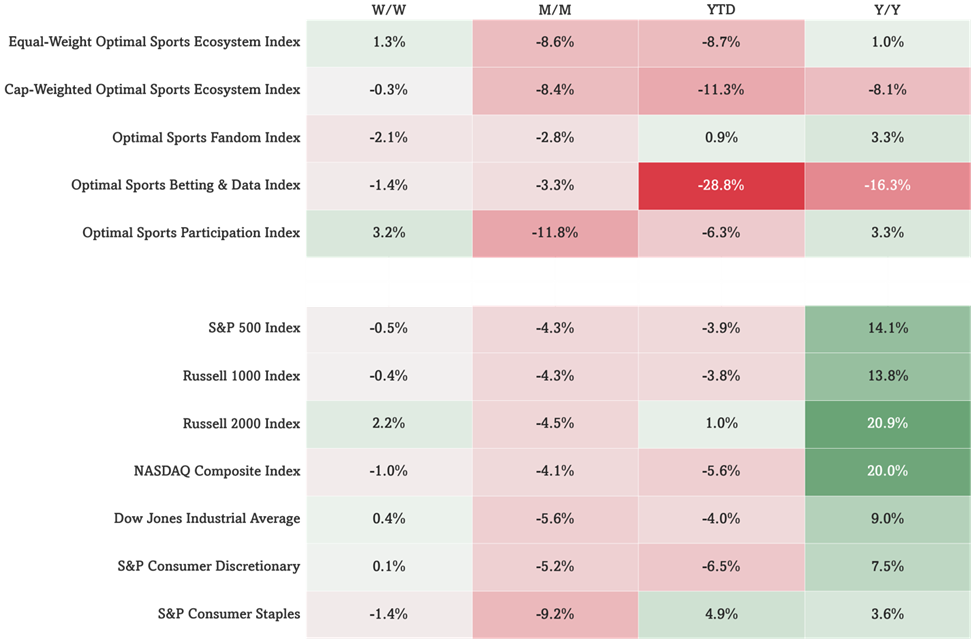
- The Sports Participation Index’s equity performance has improved over the last week (+3.2%) and outperformed benchmark indices, while the Sports Fandom Index (-2.1%) and Sports Betting & Data Index (-1.4%) equity performances have both declined over the past week and underperformed benchmarks.
Headlines
- Headline: The NBA Board of Governors approved a vote to take next steps in adding two expansion teams in Seattle and Las Vegas.
- Takeaway: Adding two new NBA franchises provides the league and its broadcasting partners with new (or in Seattle’s case returning) markets and additional games, although it remains to be seen how adding these teams affects areas such as tanking and overall league parity.
- Link: NBA expansion: Team owners approve vote to take next steps in adding teams in Seattle, Las Vegas – CBS Sports
- Headline: Monarch Collective, a women’s sports fund, has made its first major non-soccer deal after taking a minority stake in the Cleveland WNBA expansion franchise.
- Takeaway: As women’s sports viewership continues to grow, so does investment, and after the new CBA agreement last week Monarch Collective’s investment in the Cleveland expansion franchise is yet another example.
- Link: Monarch Collective takes minority stake in Cleveland WNBA expansion franchise – SportsPro
- Headline: The MLB has agreed to an official partnership with prediction market Polymarket
- Takeaway: This partnership represents another step in the rivalry between prediction markets and traditional sports betting platforms; it also provides Polymarket with access to official league data from Sportradar, who is currently the MLB’s exclusive global distributor of data for prediction markets.
- Link: MLB partners with Polymarket, makes integrity pact with CFTC | AP News
Games of the Week:
- #2 Houston vs. #2 Illinois (March 26th @ 10:05 PM EST): Houston currently has the 4th best odds of winning the tournament while Illinois currently has the 6th best odds. Whoever wins this matchup will face the winner of #4 Nebraska vs. #9 Iowa for a spot in the Final Four.
- Los Angeles Dodgers vs. Arizona Diamondbacks (March 26th @ 8:30 PM EST): The reigning World Series Champion Dodgers will start reigning World Series MVP Yoshinobu Yamamoto on the mound (as well as 4x MVP Shohei Ohtani, 1x MVP and 1x WS MVP Freddie Freeman, and 1x MVP Mookie Betts) against one of the few teams that gave them some trouble last year in the Arizona Diamondbacks (LAD won the season series 7-6), who will start Zac Gallen.
- Japanese Grand Prix (Sunday March 29th): Mercedes has dominated F1 so far this season, with drivers George Russell and Kimi Antonelli finishing first and second in both the Australian Grand Prix (Russell first Antonelli second) and the Chinese Grand Prix (Antonelli first Russell second). Both drivers are favorites to win the Japanese Grand Prix as well (Russell -185, Antonelli +330).
Stat of the Week: How “Mad” is the Sweet 16 of March Madness?
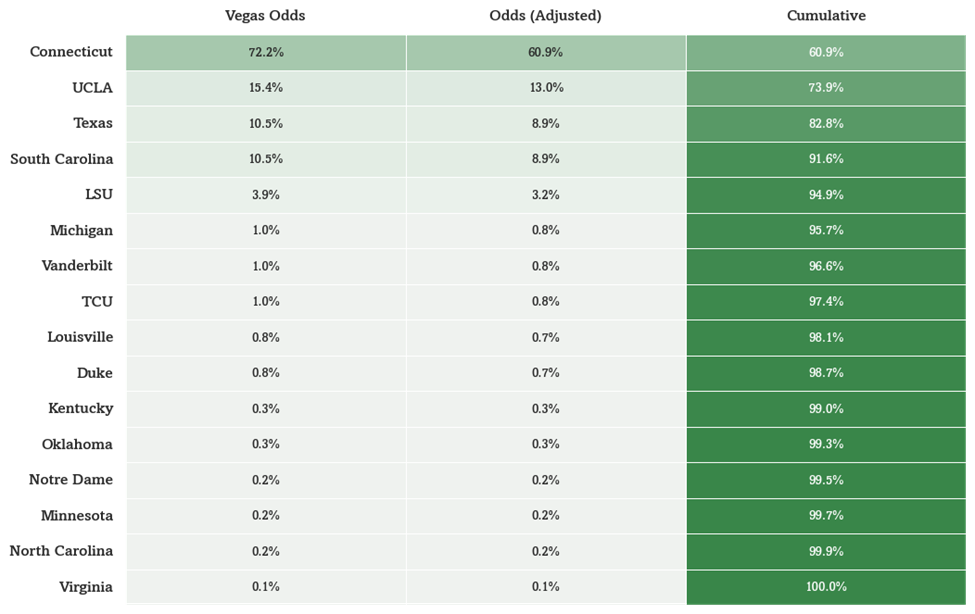
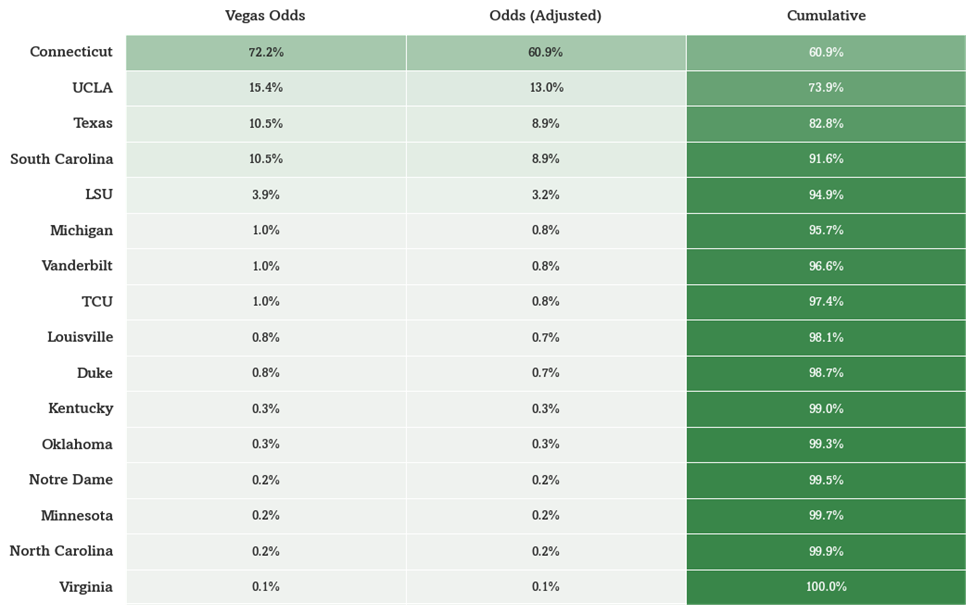
Every year, we are sold on the prospect of big upsets (none bigger so far this year than 9-seed Iowa taking down 1-seed and defending champion Florida) and Cinderella stories (such as 15-seed “Dunk City” FGCU making the Sweet 16 back in 2013). But now that we’ve reached the Sweet 16 in both the men’s and women’s brackets, what are the odds that an unexpected winner emerges? If Vegas is to be believed, it is possible but not very likely on the men’s side (as the top 6 teams by Vegas odds have a combined 79% chance of winning) and very unlikely on the women’s side (as the top 4 teams by Vegas odds have a combined nearly 92% chance of winning and UConn alone has a 61% chance).
Men’s NCAA Tournament Odds
Source: Optimal Advisory analysis, FanDuel
Women’s NCAA Tournament Odds
Source: Optimal Advisory analysis, FanDuel
Optimal Sports Ecosystem & Sectors Analysis
Optimal Sports Ecosystem Revenue Trackers
Source: Optimal Advisory Analysis, Bloomberg Second Measure
Optimal Sports Ecosystem Index Revenue Tracker
Source: Optimal Advisory Analysis, Bloomberg Second Measure
Optimal Sports Betting & Data Index Revenue Tracker
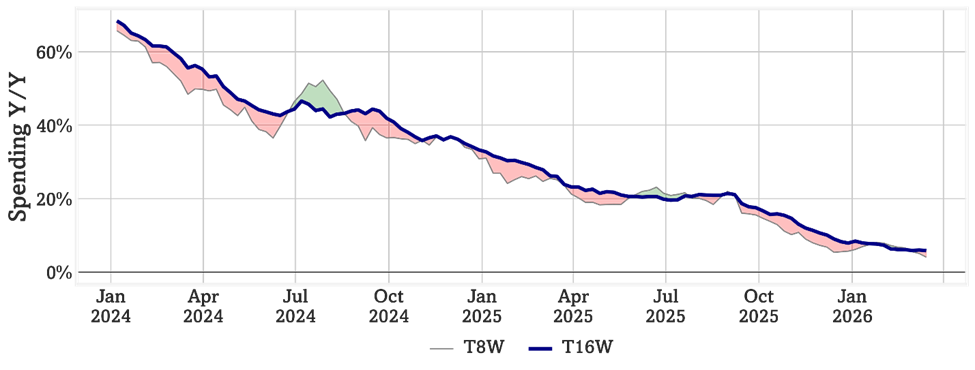
Source: Optimal Advisory Analysis, Bloomberg Second Measure
Optimal Sports Fandom Index Revenue Tracker
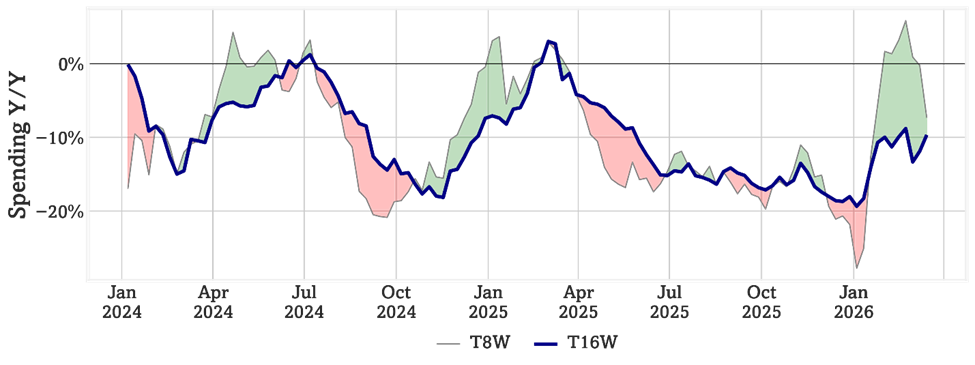
Source: Optimal Advisory Analysis, Bloomberg Second Measure
Optimal Sports Participation Index Revenue Tracker
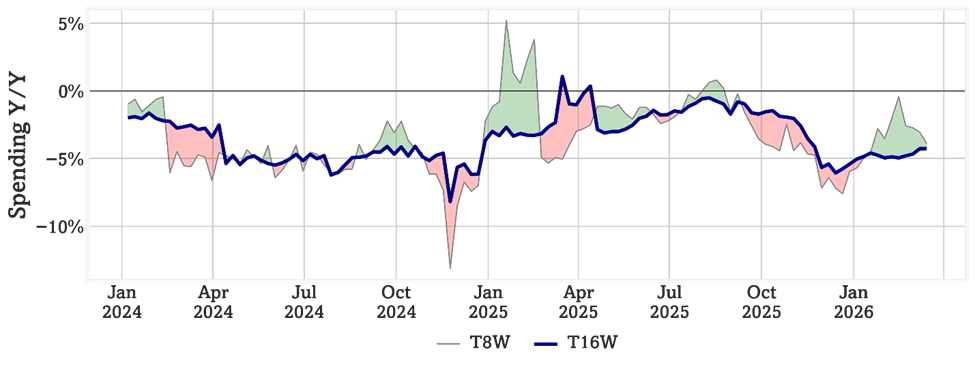
Source: Optimal Advisory Analysis, Bloomberg Second Measure
Optimal Sports Entertainment and Experiences Revenue Tracker
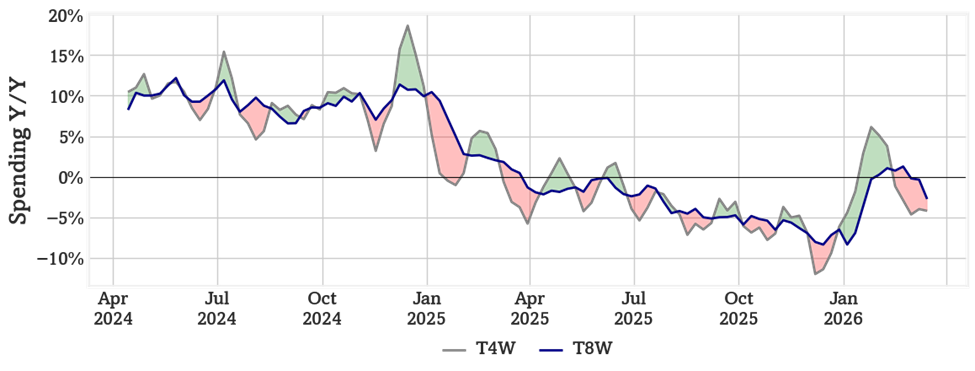
Source: Optimal Advisory Analysis, Bloomberg Second Measure
Spending, Digital Traffic, & Foot Traffic Inflections (T8W vs. T16W)
Source: Optimal Advisory Analysis, Bloomberg Second Measure, Similarweb, Placer.ai
Online Traffic vs. Card Spending Growth
Source: Optimal Advisory Analysis, Bloomberg Second Measure, Similarweb
Top Twitter & News Sentiment Monthly Gainers and Declines
Source: Optimal Advisory Analysis, Bloomberg
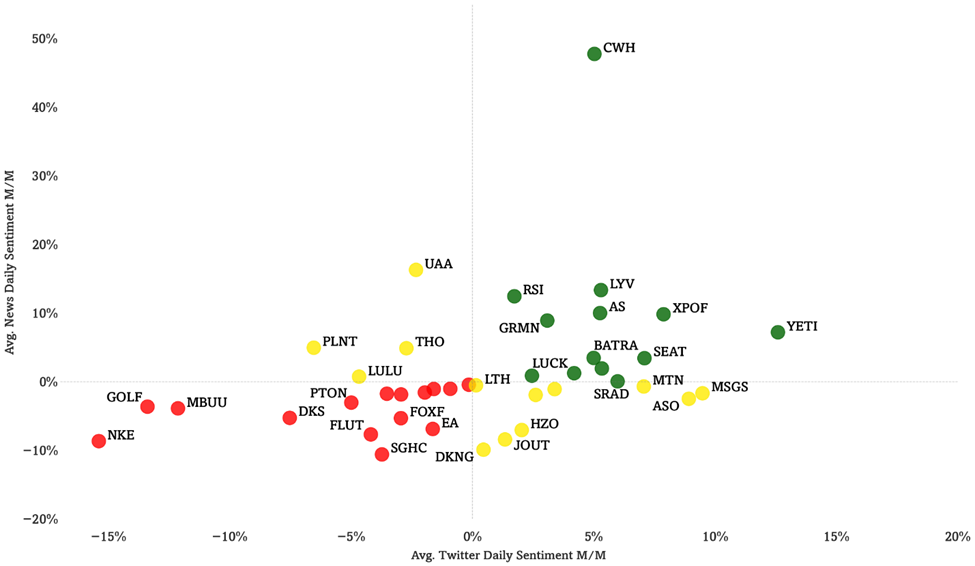
Twitter Sentiment vs. News Sentiment Monthly Change
Source: Optimal Advisory Analysis, Bloomberg
Sports Category Digital Inflections
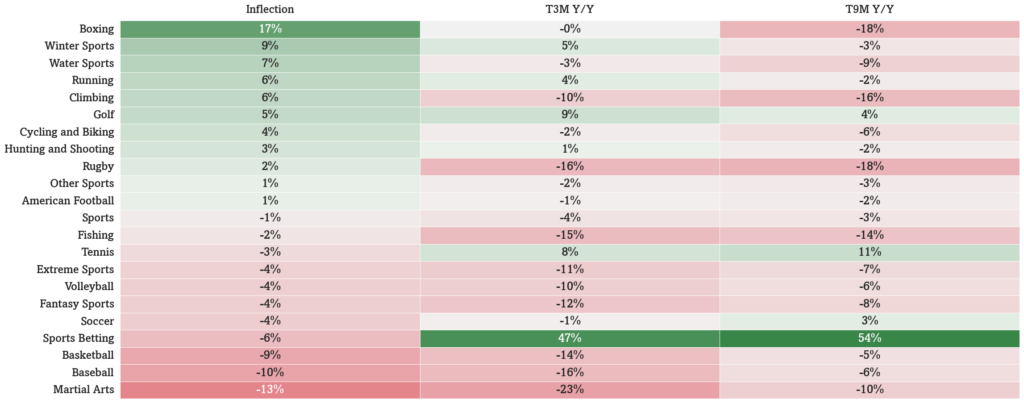
Source: Optimal Advisory Analysis, Similarweb
NKE Trends Weekly Analysis
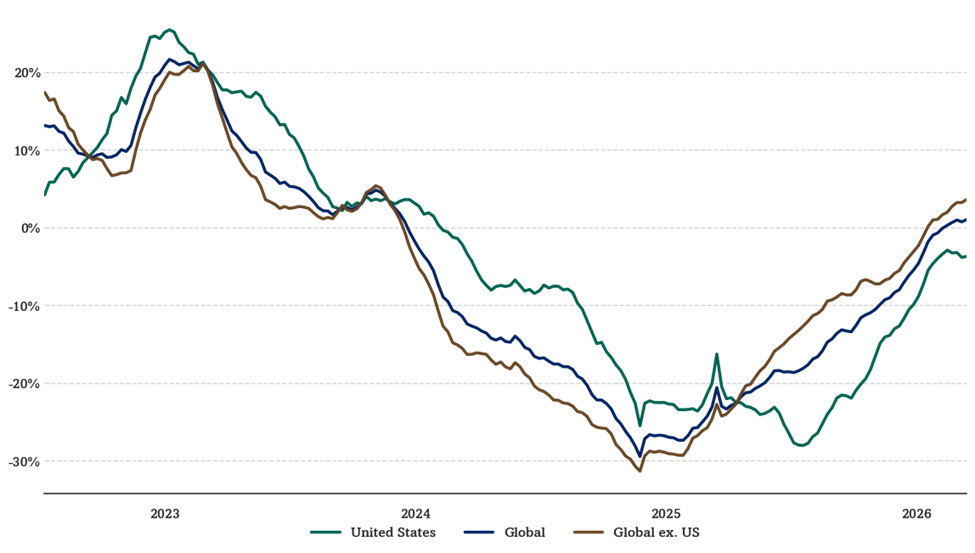
Despite some headwinds for NKE, including the reimposition of tariffs as well as pressures in China, we are still seeing improving trends in NKE’s global attention economy trends, although trends have begun to level off.
NKE International Global Attention Economy Trends (T16W Y/Y)
Source: Optimal Advisory Analysis, Bloomberg, Similarweb
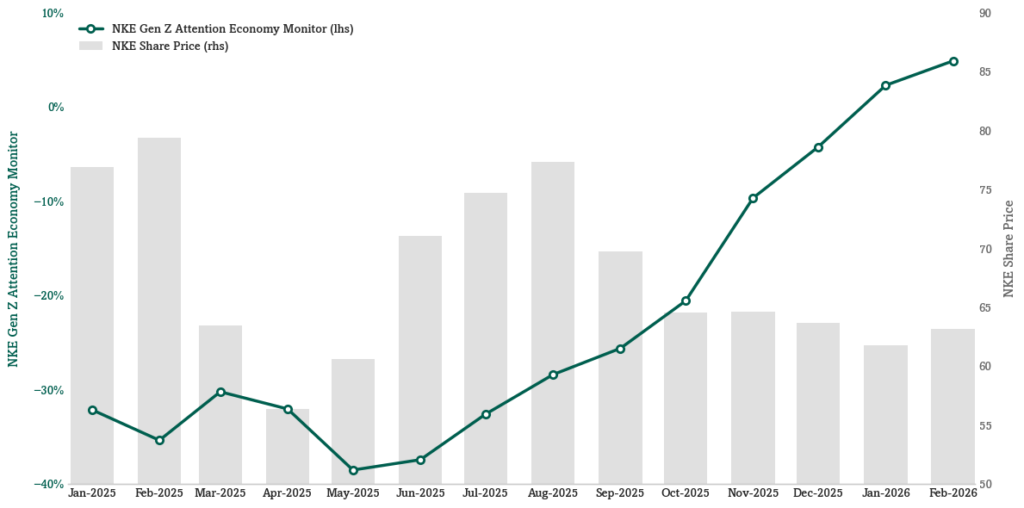
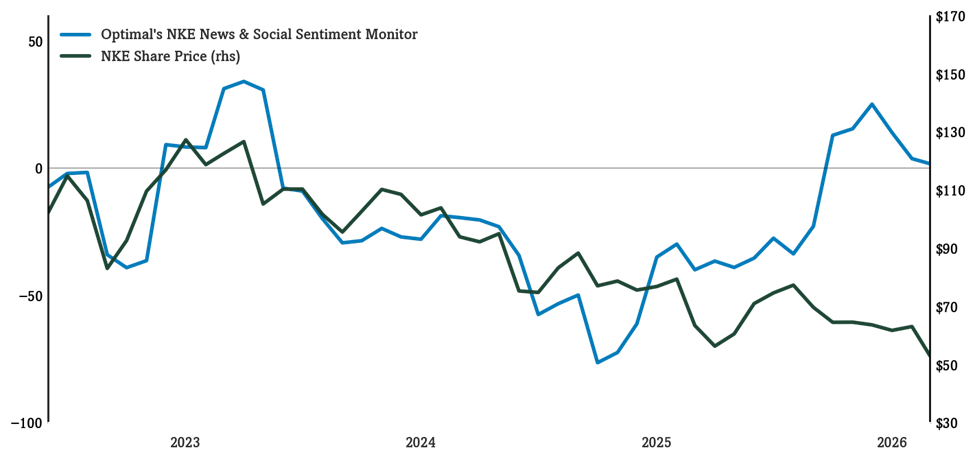
Our Gen Z Attention Economy Monitor, which monitors how Gen Z consumers interact digitally with individual brands, continues to improve for NKE. This metric, which had been running negative throughout 2025 (and at times highly negative), inflected positively last month (+2% y/y) and continued to rise in February (+5% y/y). Meanwhile, Optimal’s News & Social Sentiment Monitor also turned positive for NKE in recent months for the first time since early-mid 2023 (although it has decreased in recent months).
Gen Z Attention Economy Monitor
Source: Optimal Advisory Analysis, Similarweb
NKE News & Social Sentiment Monitor
Source: Optimal Advisory Analysis, Bloomberg
Optimal’s In-Store Monitor and Online Monitor for NKE have both historically tracked the share price; however, this relationship has broken down recently as in-store and online trends have improved while share price has continued to decline. Optimal’s In-Store Monitor and Online Monitors have both decelerated relative to recent weeks but the Online Monitor is outperforming late-2025 trends while the In-Store Monitor is in-line with overall recent trends and outperforming late-2024 trends.
NKE In-Store Monitor vs. Share Price
Source: Optimal Advisory Analysis, Placer.ai, Bloomberg
NKE Online Monitor vs. Share Price
Source: Optimal Advisory Analysis, Similarweb, Bloomberg
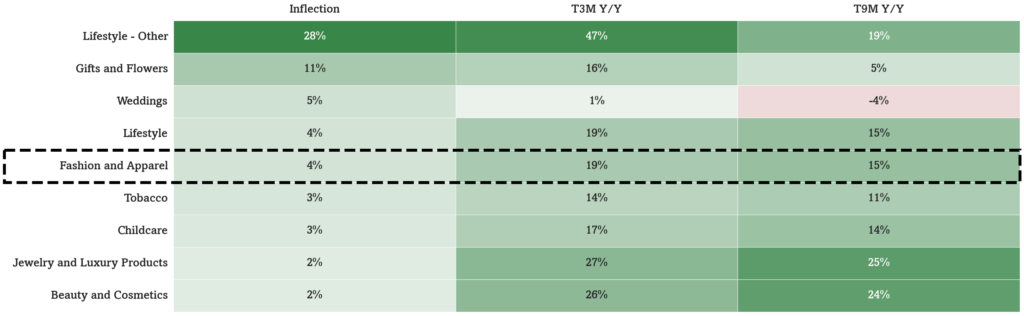
We also note improving online traffic trends for both lifestyle brands as a whole and more specifically for fashion and apparel brands, as traffic growth is both improving and accelerating (growth was also +19% T3M y/y last month).
Online Traffic to Fashion & Apparel Websites is Improving and Accelerating
Source: Optimal Advisory Analysis, Similarweb
Equity Performance
Index & Sector Performance
Source: Optimal Advisory Analysis, Bloomberg, prices at market close 3/25/2026
Valuation Snapshots
Optimal Sports Betting & Data Index Components Valuation Snapshot
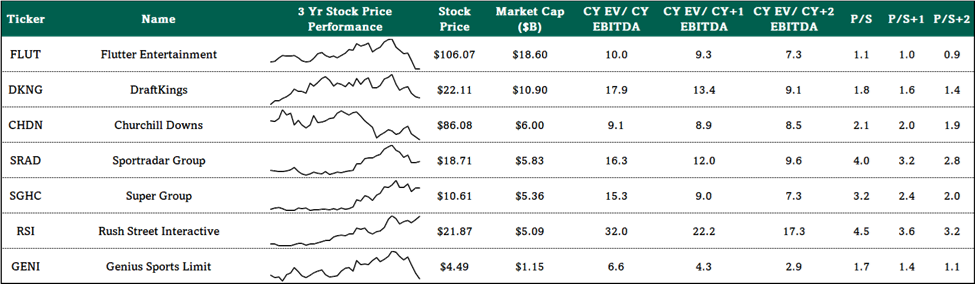
Source: Optimal Advisory Analysis, Bloomberg
Optimal Sports Fandom Index Components Valuation Snapshot
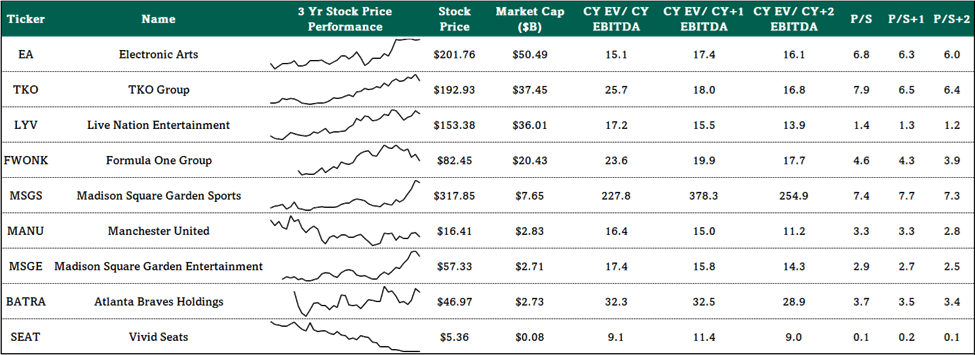
Source: Optimal Advisory Analysis, Bloomberg
Optimal Sports Participation Index Components Valuation Snapshot
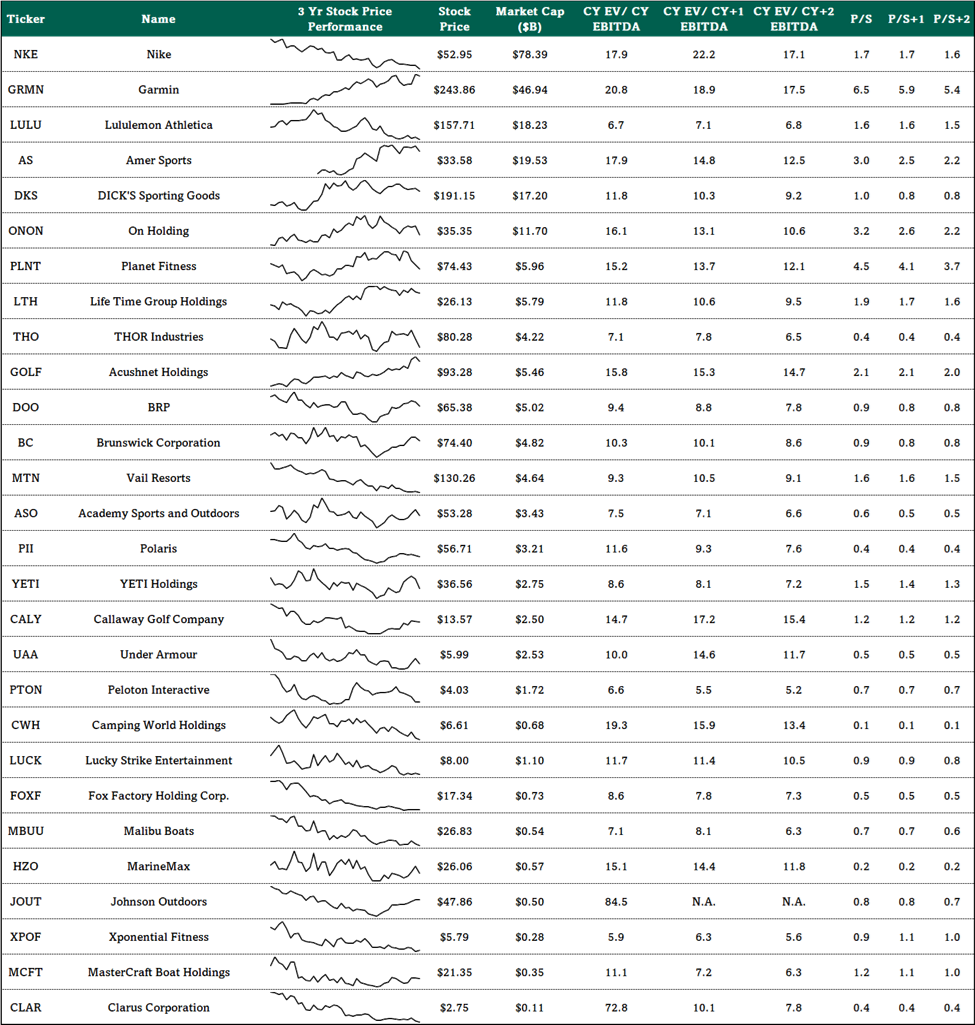
Source: Optimal Advisory Analysis, Bloomberg