Bob’s Discount Furniture S-1: Demographic Analysis; Compelling Store & Delivery Experience; Know Who They Are; Store Pics (Including Outlet)
We’ve had incoming questions about the recently filed Bob’s Discount Furniture S-1. We have consolidated some of our basic thoughts (and store pics) into this note.
TLDR = Positive. We like the product and experience, we see compelling cultural attributes, and our analysis sees important demographic traction. As customers, we have bought multiple SKUs in multiple rooms over multiple years from multiple Bob’s stores. The store, product, digital, and delivery process are better than most in the category. While we see an element of beneficial timing to this IPO (better trends, certain competitive threats diminished) and expect investor conversations around that risk, the 12% long-term store growth story. To us, Bob’s “knows who they are”, which that is key to consumer concepts. Our store visits have noticed the “old school” retail of knowledgeable, commissioned salespeople spending lots of time with customers versus other value-priced concepts. Our proprietary analysis of customer engagement data (below Figs 18-23) suggests relatively young customers (demographics and traction).
Bob’s has an interesting fit within the competitive landscape. First, our analysis suggests decreasing cross-shop with some of the most challenging competitors like AMZN and W. Second, we like where Bob’s sits in the competitive stack. We even like the word “Discount” in the brand name. Promotions are a necessary evil in home furnishings, so admitting and embracing the discount element reduces some risk of frustrating customers that feel they must time their spend to the vagaries of a promotional calendar. Lastly, while uncertainties remain around tariffs (overall and in home furnishings) we note Bob’s 63% Vietnam and 27% US sourcing is a relatively good setup. Our work with companies expanding their supply chain in Vietnam have pointed to continued benefits and improvements. We track both ticket and transaction count across the sector below.
Risks include: the space remaining competitive; some players may blink in promotions; sourcing always a risk but Vietnam is one of the best markets, from our channel work. The macro is helping right now and this IPO timing is perhaps taking that into account – when that macro changes these businesses can have a tough time. Home furnishings can have powerful multi-year demand surges but these are durable goods – when the demand is met the couch is sitting in the room. Home turnover has been very sluggish since the 2021 pop from low rates and Covid lifestyle changes. Turns matter for home furnishings (and the economy). Mortgage applications for home purchases and refinancing both lead spending in home categories by about 6 months, and have accelerated over the last few months. This should be a good tailwind in late CY26. As mentioned, any specific geopolitical or trade issues with 63% of the product sourced from Vietnam could be a risk. We note average store size has been creeping higher of late, we’d like to see that stop (and go the other way).
Below we combine our analysis of spending and digital trends to measure inflections in brand positioning in the furniture retail space. Bob’s outpaces measured peers in consumer card spending growth, engaged digital visits growth, and with decelerating cross-shop of e-commerce platforms. We also include store pics. See below.
Figure 1: Furniture Public Comparables
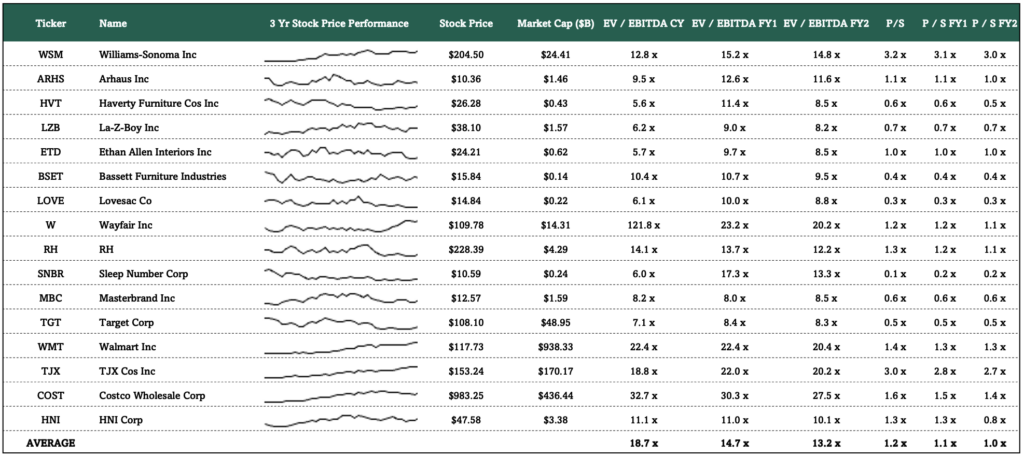
Source: Optimal Advisory Analysis, Bloomberg, prices as of 1/23/2026
Figure 2: Bob’s Historical Growth
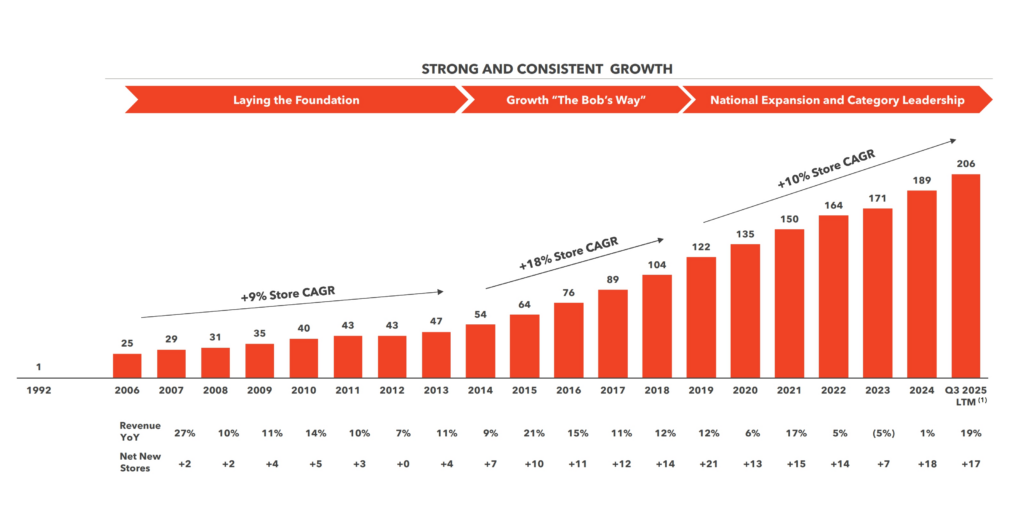
Source: Optimal Advisory Analysis, Bob’s Discount Furniture, Form S-1
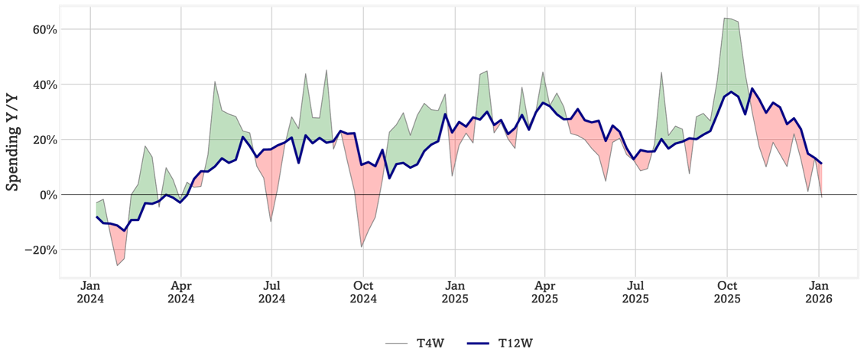
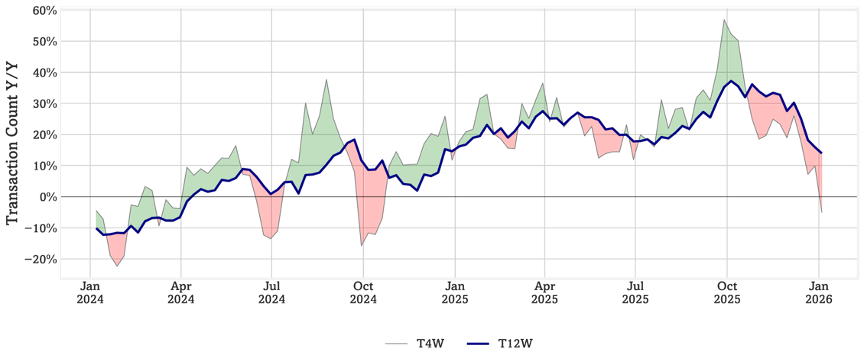
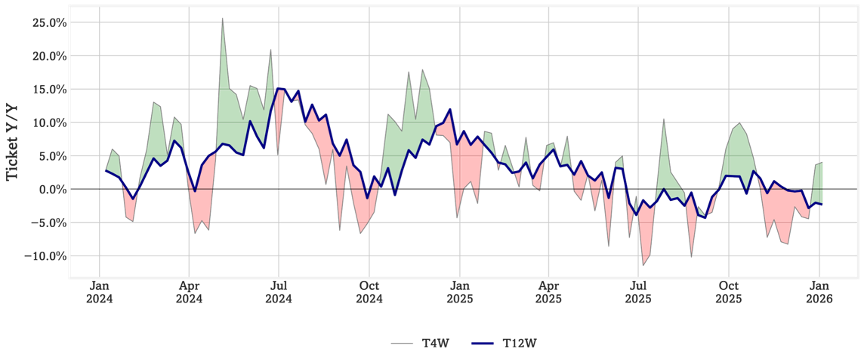
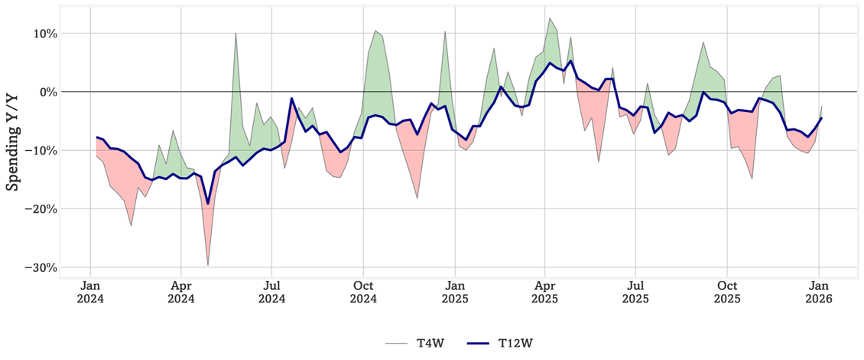
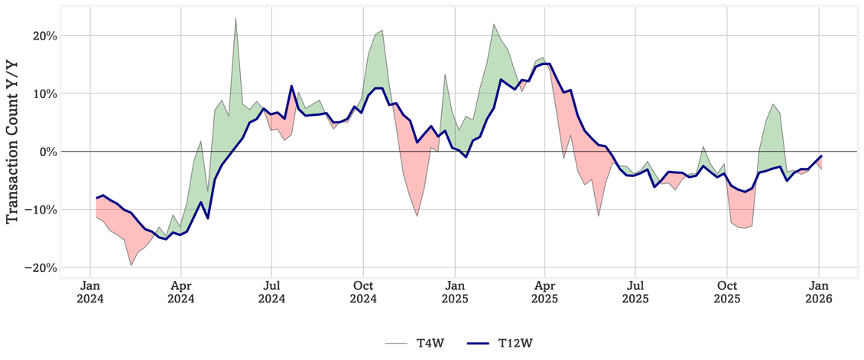
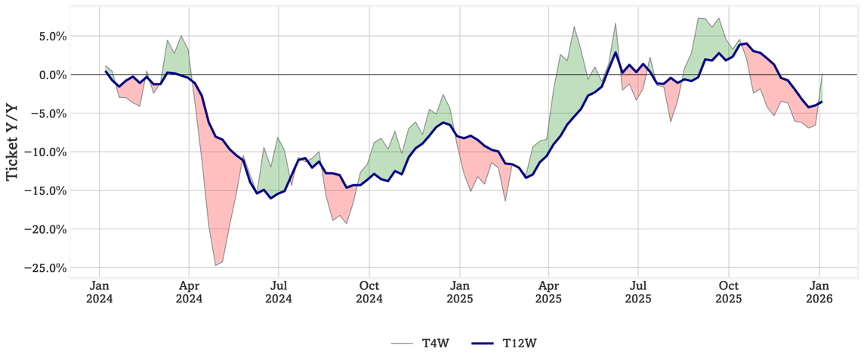
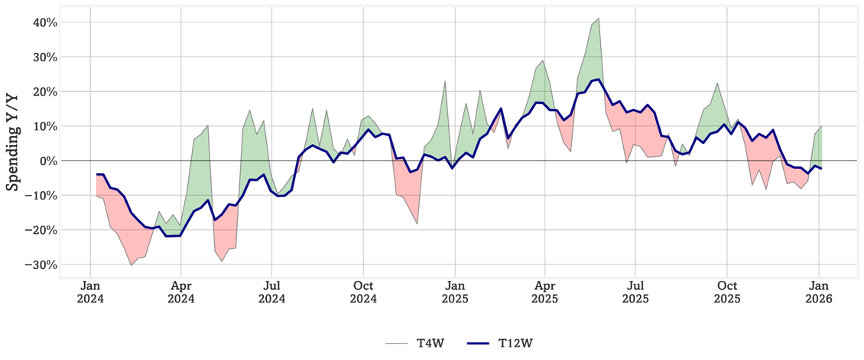
Figure 3-14: Furniture Retail Spending Trend Analysis
Bob’s is currently leading measured peers in longer-term spending growth (+11% y/y) while IKEA (-10%), Wayfair (-4%), and Ashley (-2%) are all down y/y. Ticket growth is running up for all four companies on a shorter-term basis.
Bob’s Credit Card Spending Y/Y
Bob’s Transaction Count Y/Y
Bob’s Ticket Y/Y
IKEA Spending Y/Y
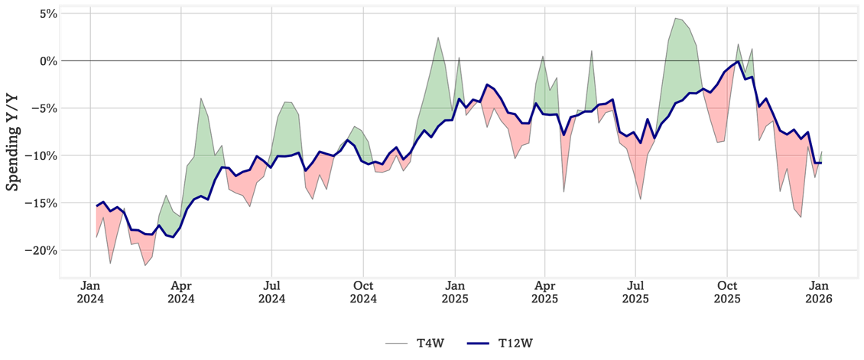
IKEA Transactions Y/Y
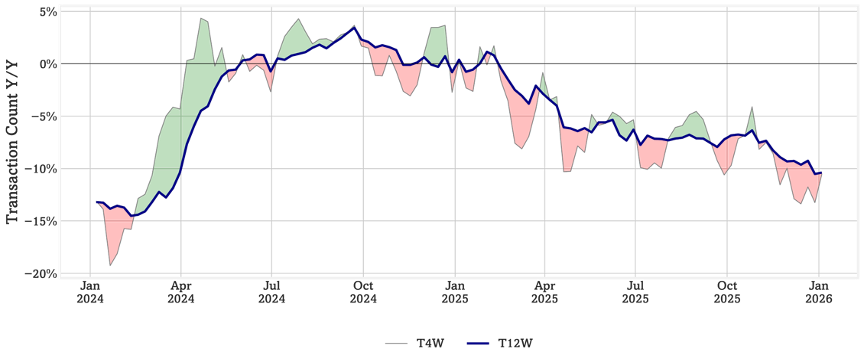
IKEA Ticket Y/Y
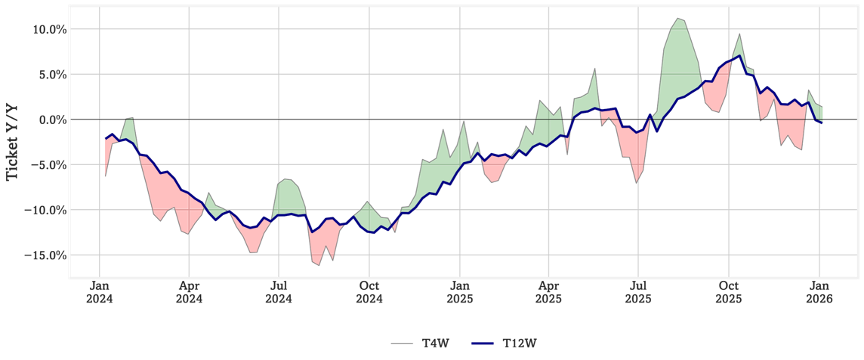
Wayfair Spending Y/Y
Wayfair Transactions Y/Y
Wayfair Ticket Y/Y
Ashley Spending Y/Y
Ashley Transactions Y/Y
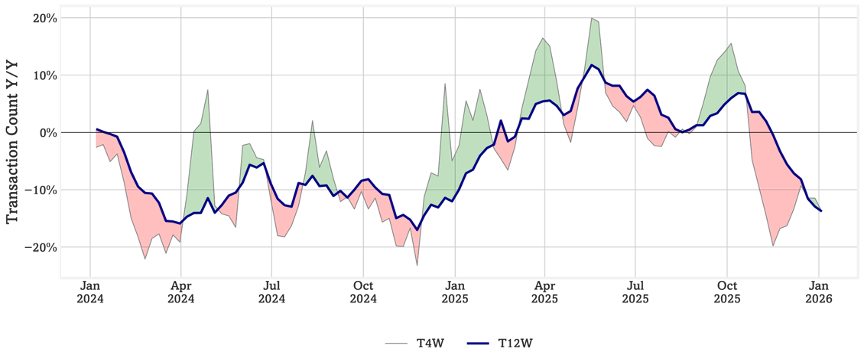
Ashley Ticket Y/Y
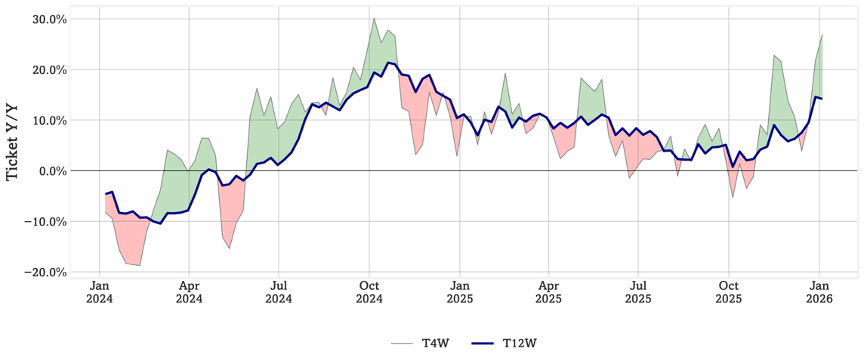
Sources: Optimal Advisory Analysis, Bloomberg Second Measure
Figures 15-17: Optimal Advisory Digital Engagement Analysis
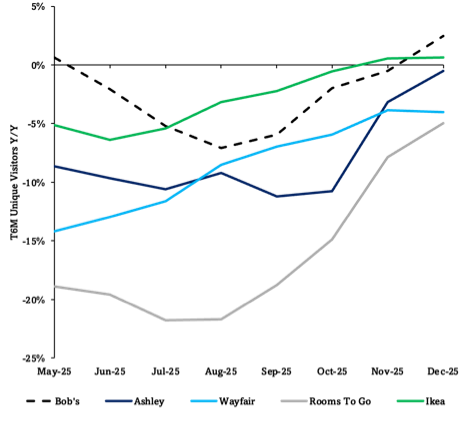
Bob’s digital engagement growth among “engaged” visitors leads the industry, and unique visitors have grown more than Ikea’s while Ashley, Wayfair, & Rooms To Go showed y/y declines. Bob’s digital visitors also visit Amazon, Wayfair, & Target on the same day less than they did during the same period last year, and visit eBay & Ikea slightly more.
T6M “Engaged” Digital Visits Growth vs. Total Visits

T6M Y/Y Unique Digital Visitor Growth
Same Day Cross Visiting Percentage
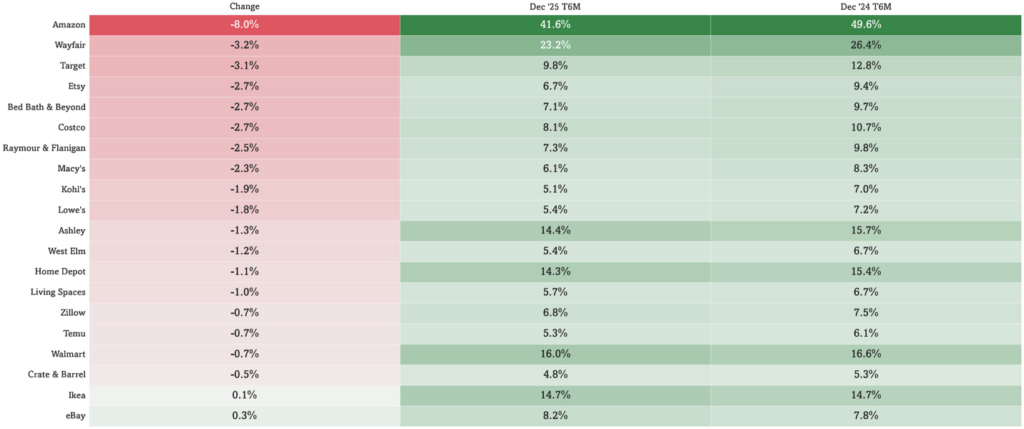
Source: Optimal Advisory Analysis, Similarweb
Figures 18-23: Optimal Advisory Digital Demographic & Engagement Analysis
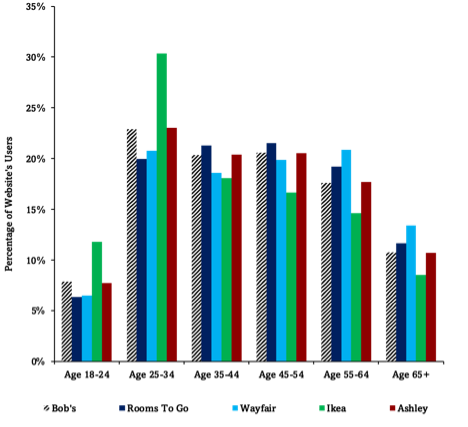
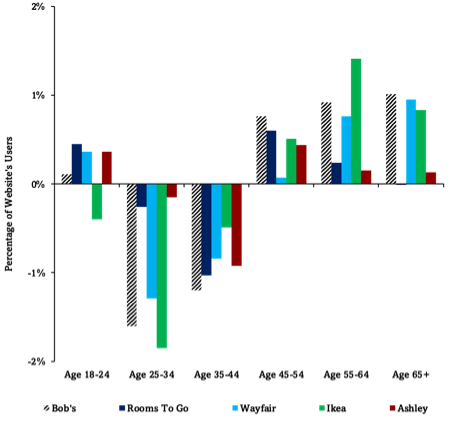
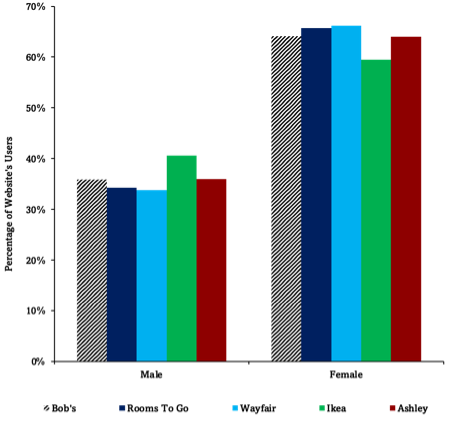
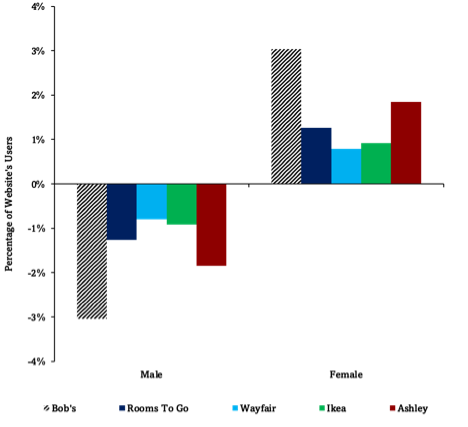
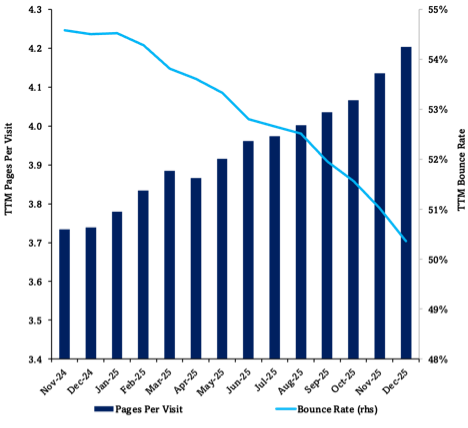
Bob’s digital traffic skews younger than Wayfair & Rooms To Go, older than Ikea, and similar to Ashley; Bob’s digital traffic has gained share among older and female users relative to last year. Bob’s pages per visit has steadily increased since the end of 2024, while bounce rate (the percentage of visitors that only view one page on the website before leaving) has steadily decreased over the same timeframe.
Digital Age Distribution (T6M)
Digital Age Distribution (T6M Y/Y)
Digital Gender Distribution (T6M)
Digital Gender Distribution (T6M Y/Y)
Pages Per Visit & Bounce Rate
Source: Optimal Advisory Analysis, Similarweb
Bob’s Discount Furniture – Store Pics
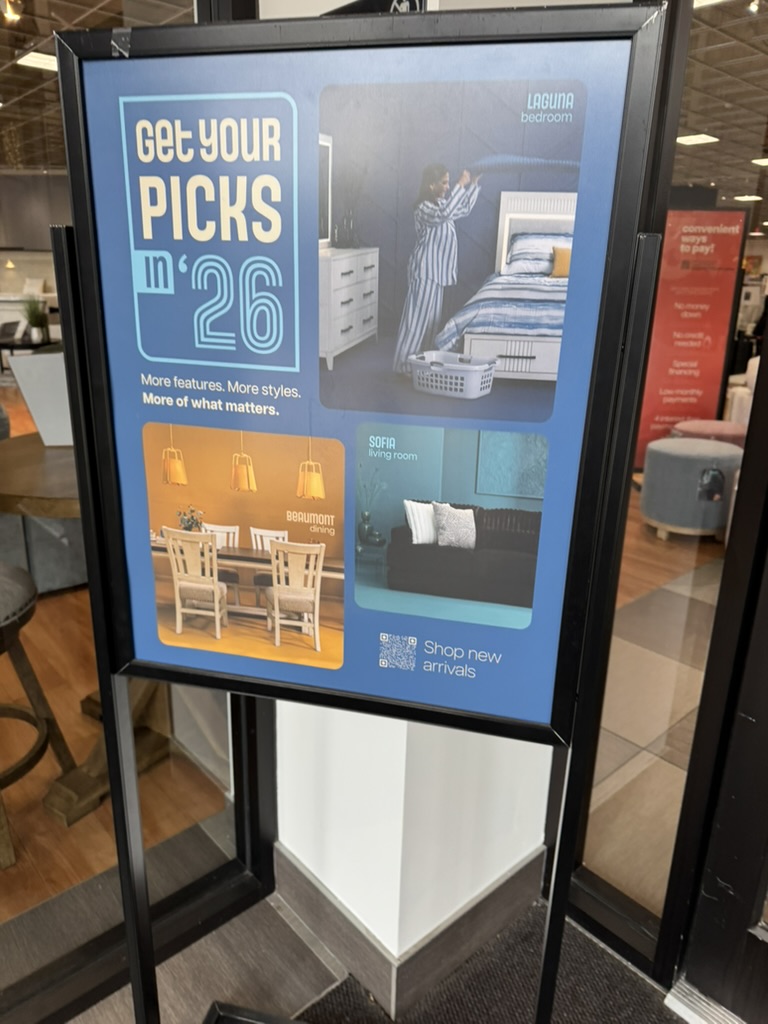
New Arrivals Signage in Entrance
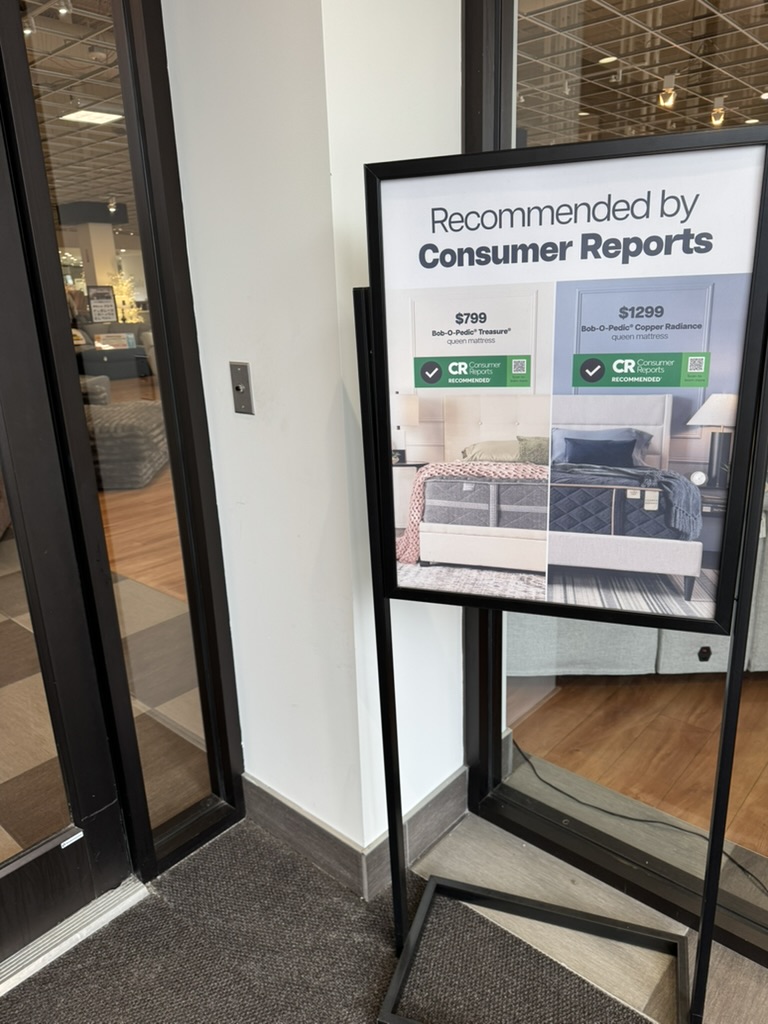
Relative Value and 3rd Part Recommendation Signage in Entrance
Comparison Focus Continues in First Set in Store
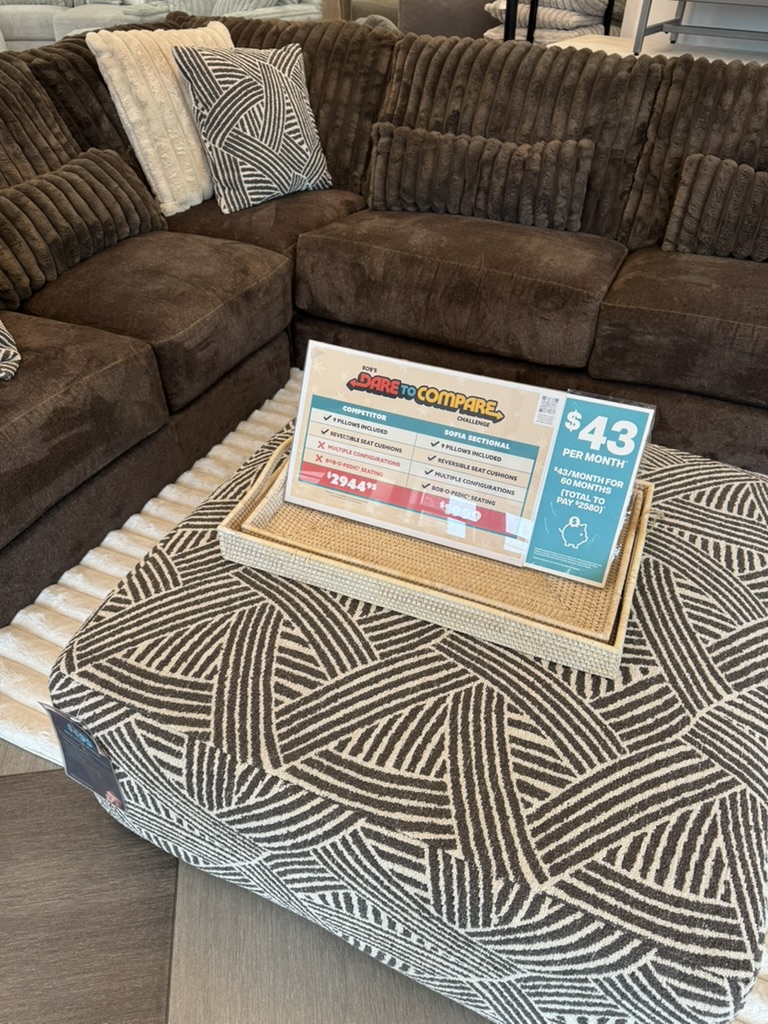
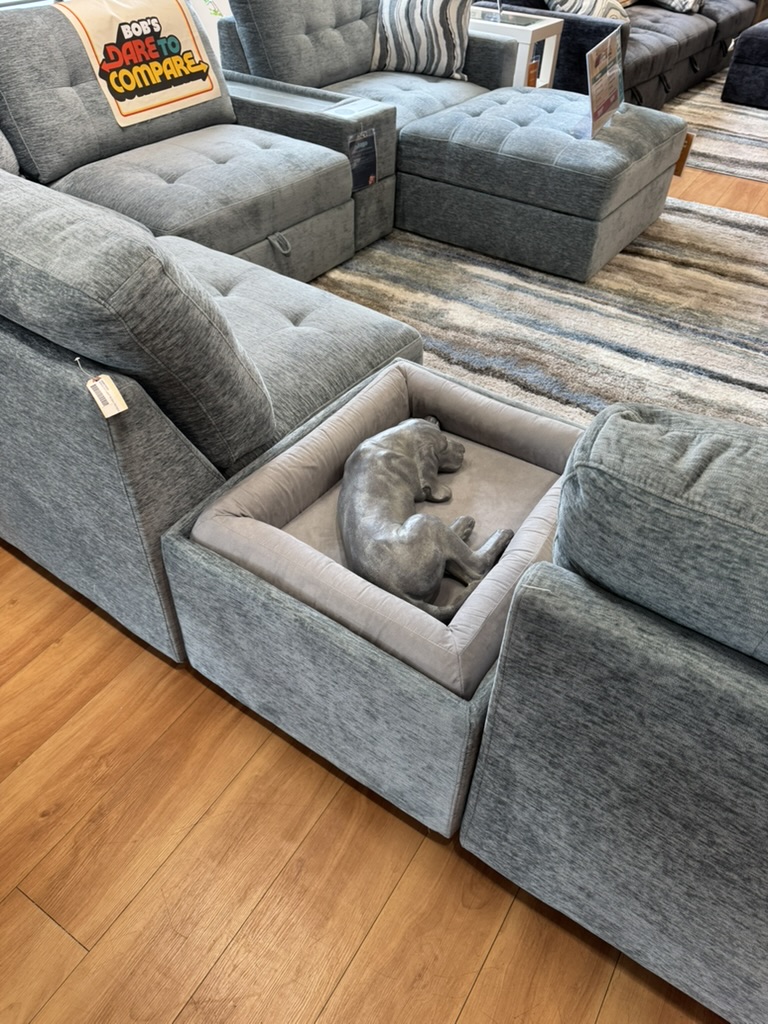
Not a Real Dog, but Interesting to Build Dog Bed into Sectional!
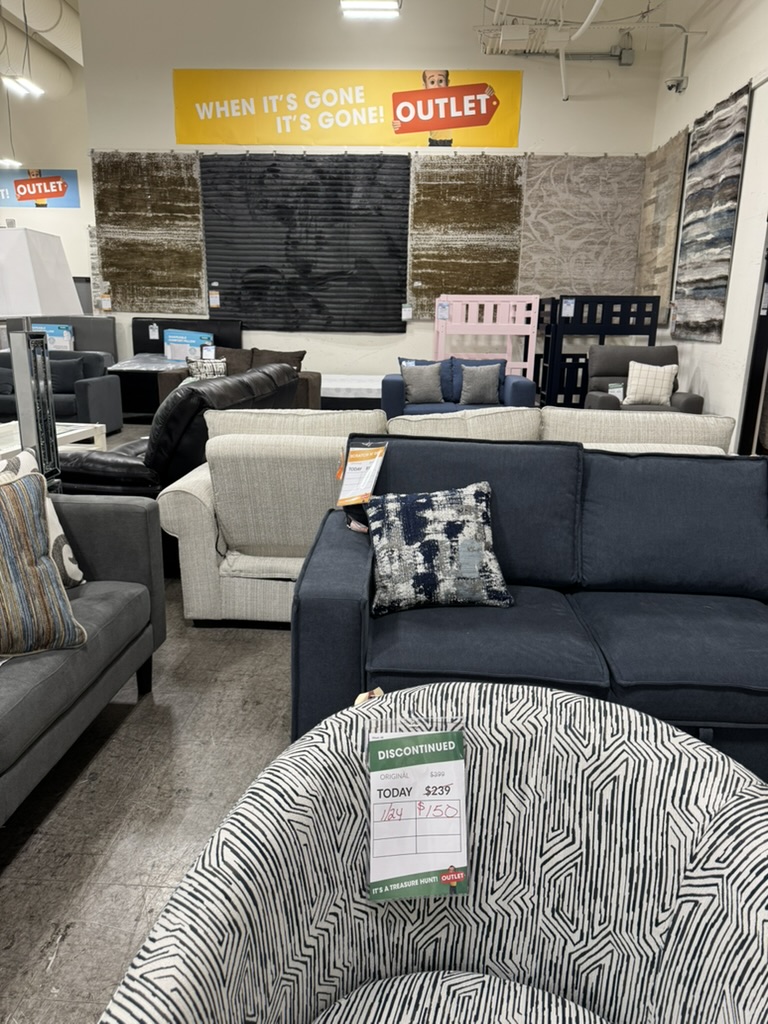
Outlet Section of Store in Back, Clearly Delineated, Well Staffed Like the Front of Store
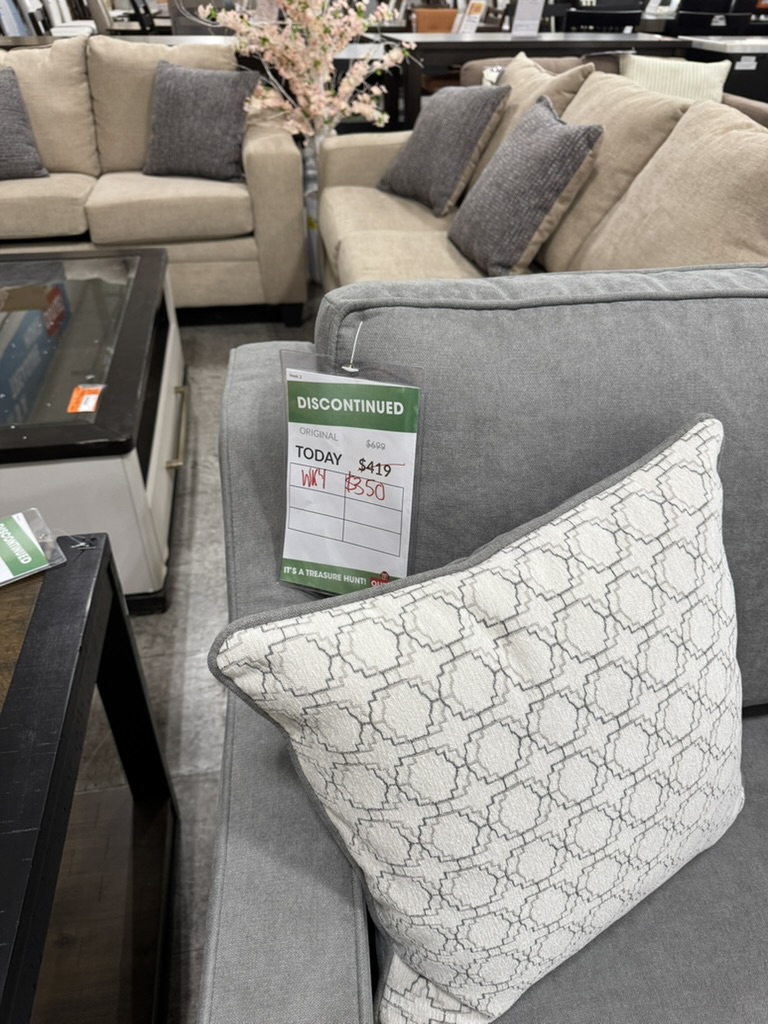
Outlet Section Combines Damaged & Discontinued Items
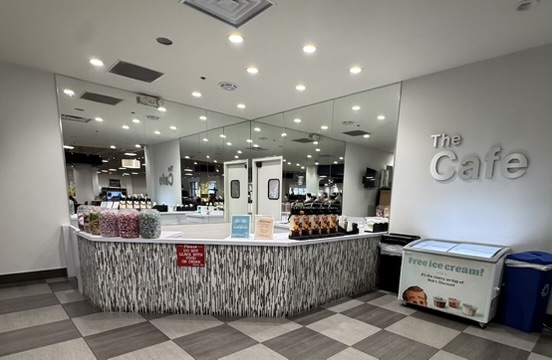
The Cafe: Coffee, Candy, and Free Ice Cream While Shopping
Source for all store pics: Optimal Advisory