Consumer Cost Inputs Ease: -1.3% w/w, +2.2% y/y, LW+, MDLZ+, Wing Restaurants+, CPB-, CELH-. Friday Cost Factor.
The Optimal Advisory Cost Factor fell this week (-1.3% w/w) after 6 consecutive weeks of higher weekly input costs. Continued tailwinds from food products are offset by disruptive war-driven moves in packaging and transportation input costs. Index was -12.9% y/y just 7 weeks ago.
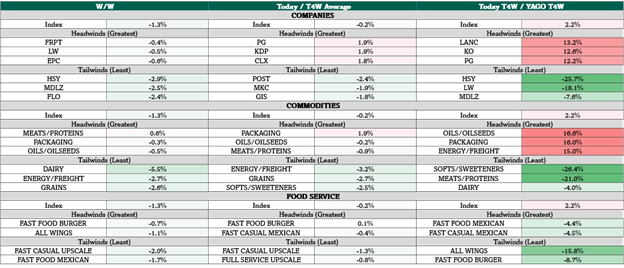
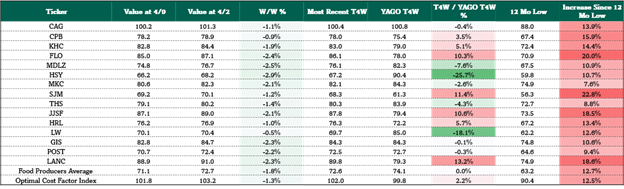
Cost tailwinds to watch: Softs/Sweeteners down -26.4% y/y, HSY -25.7% y/y, LW -18.1% y/y, Wing restaurants -15.8% y/y. See Fig 1.
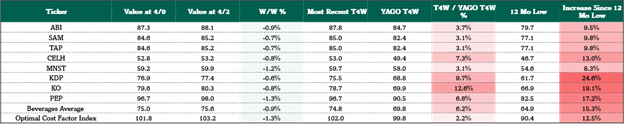
Cost headwinds to watch: Oil/Oilseeds +16.6% y/y, Packaging +16.0% y/y, MZTI +13.2% y/y, KO +12.6% y/y, Energy/Freight +15.0% y/y. See Fig 1.
Oil relief from ceasefire; (-10.9% w/w); future unclear. Iran war driven spikes are moderating selectively, while widening slightly. Plastic Packaging (+95% ytd), Aluminum (+14.6% ytd), and Steel (+11.2% ytd) are all packaging input costs that are moving higher as energy prices have remained elevated for more than 4 weeks. See Fig 5-8.
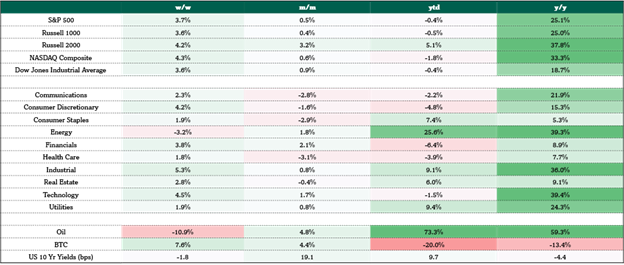
Higher energy costs & shipping risk are implicitly an immediate tax on everything: Within COGS, they drive the cost of packaging (esp. aluminum), inbound & outbound freight as well as farm level costs (diesel, fertilizer) that are key to plantings, supply & future food inputs. Within SG&A, they drive delivery costs. They also threaten revenue with more consumer budget constraints. We monitor weekly performance of key equity indices and macro indicators. See Fig 11.
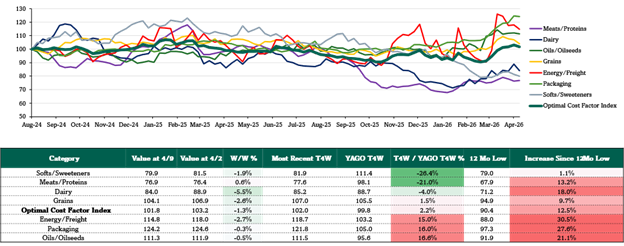
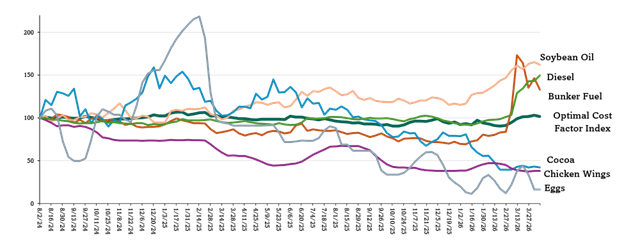
Cost Factor -1.3% w/w, +2.2% y/y (vs. prior week +0.8% w/w & +0.4% y/y). Spot energy inputs moderated but remain significantly elevated compared to the start of the year. (notably: Bunker Fuel +90.9% ytd, but down -23.3% m/m; Diesel up 4.5% w/w, and +61.2% ytd).
In this weekly note, we identify spot input costs’ putative impact on the U.S. fast moving consumer goods (FMCG) value chain, most measurably impacting staples, staples retailers, restaurants & food service. Optimal’s proprietary cost factor weights ticker & sector specific cost trends using a proprietary formula based on 32 trackable spot cost inputs – 23 of which are updated as of last night, the other 9 are latest available.
Figure 1: Weekly Cost Factor Summary
Sources: Optimal Advisory Proprietary Analysis, Bloomberg, FRED, USDA, BEA
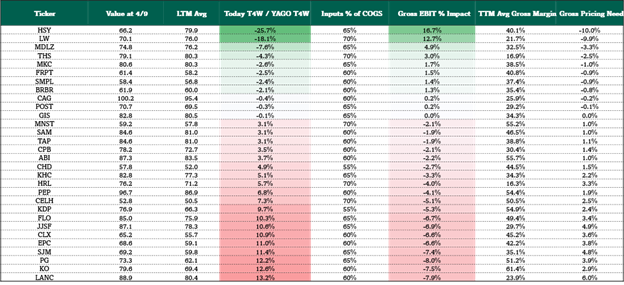
Figure 2: Weekly Cost Factor Margin Context
Sources: Optimal Advisory Proprietary Analysis, Bloomberg, FRED, USDA, BEA
Figure 3: Weekly Input Commodity Performance by Group
Sources: Optimal Advisory Proprietary Analysis, Bloomberg, FRED, USDA, BEA
Figure 4: Biggest Input Cost Movers y/y
Sources: Optimal Advisory Proprietary Analysis, Bloomberg, FRED, USDA, BEA
Figure 5: Food Sector Cost Factor
Sources: Optimal Advisory Proprietary Analysis, Bloomberg, FRED, USDA, BEA
Figure 6: Beverage Sector Cost Factor
Sources: Optimal Advisory Proprietary Analysis, Bloomberg, FRED, USDA, BEA
Figure 7: HPC Sector Cost Factor

Sources: Optimal Advisory Proprietary Analysis, Bloomberg, FRED, USDA, BEA
Figure 8: Restaurant Level Cost Factor

Sources: Optimal Advisory Proprietary Analysis, Bloomberg, FRED, USDA, BEA
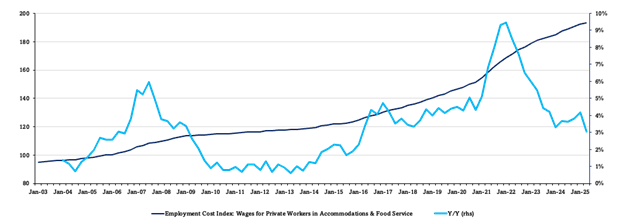
Figure 9: Restaurant Employment Cost Index
Sources: Optimal Advisory Proprietary Analysis, Bloomberg, FRED, USDA, BEA
Figure 10: Staples Sector Theme Box
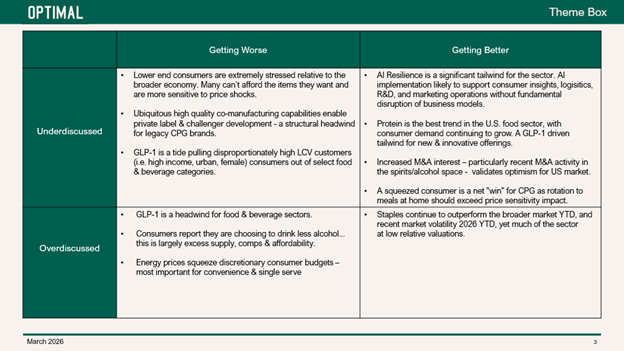
Figure 11: Market Sector Performance
Sources: Optimal Advisory Proprietary Analysis, Bloomberg