Consumer Velocity Slows Again Last Week; Significantly Non-Normal Premium v Value Dispersion; Historically Low Sentiment: Macro Monday
Consumer Velo softened further last week … shorter-term spending trend decline is now at -1.7% y/y (this metric was running -0.5% y/y prior week, +4% in August and +3% in September). Our analysis of the trailing 4-week moving average of sales at 133 retailers and consumer concepts is now running down -1.7% y/y (this is 2.2 standard deviations below average since the start of 2022) and is down -2.3% y/y this week alone. Simply put, both pace and slope of overall consumer spending are soft. The trailing 12-week trend is now flat y/y, leading to a shorter vs. longer-term inflection of -1.7% (0.9 standard deviations below average), the 17th straight week of shorter-term trends running below longer-term trends. See Fig 1-2.
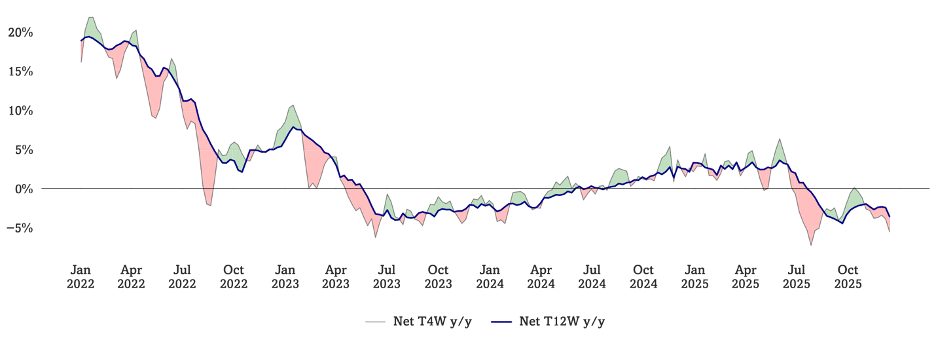
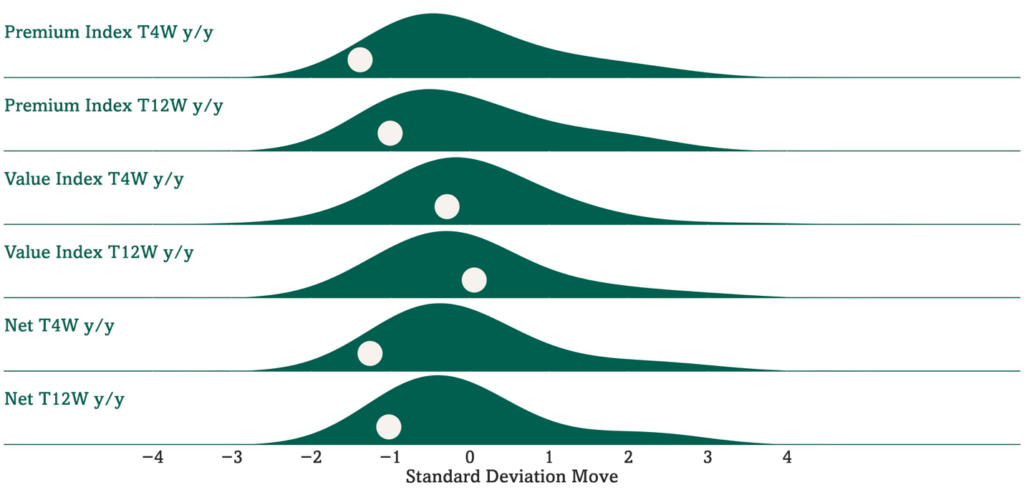
Our Premium Index is tracking softer than Value, primarily driven by softer high-end spending. We use a combination of consumer spending and psychographic monitoring to track “trade up” and “trade down” trends. Optimal’s premium monitor is running down -4.6% y/y on a T4W basis and down -1.6% y/y on a T12W basis, running 560 bp (1.2 standard deviations below average) and 360 bp (1.0 standard deviations below average) respectively below our Value Monitor, which is running up 1.0% y/y on a T4W basis and 2.0% y/y on a T12W basis. See Fig 3-6.
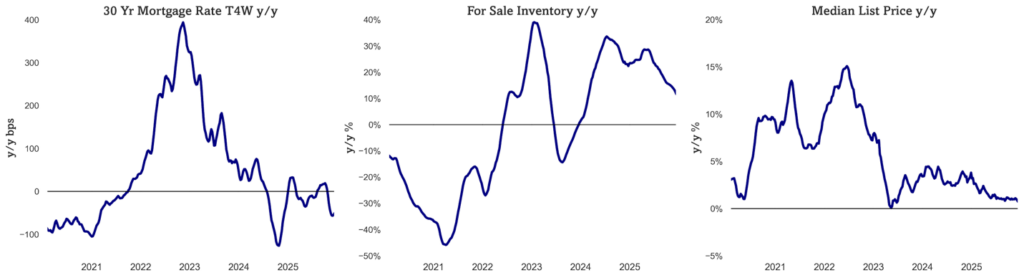
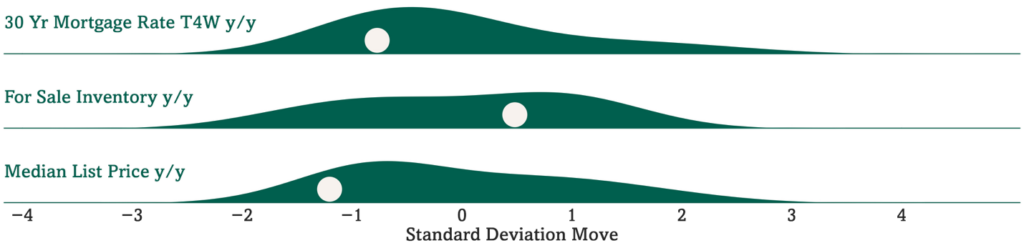
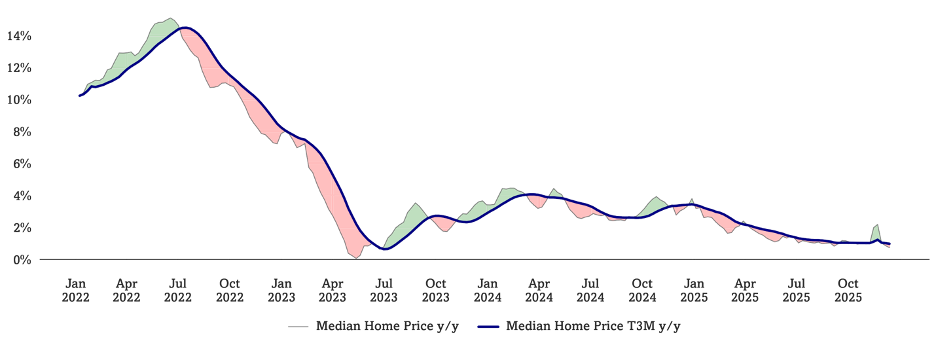
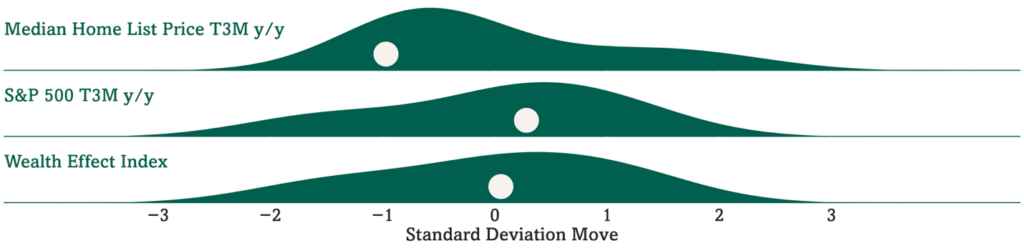
Consumer housing “kinetic energy” is mixed; inventory still growing but slower, mortgage rates decel with stable home prices nationally. For sale inventory running up +11.7% y/y (0.5 standard deviations above average) but at the lowest y/y level since early 2024. US 30Y FRM rate continues to move lower, now running down -51bps y/y on a T4W basis. MBA’s mortgage applications for purchase are currently running +17% y/y. We continue to expect softer home prices to drive turns in 2026. Late 2025 mortgage application trends also suggest turns pickup (and related hardgoods demand) in 2Q26. Median home prices are running up +1.6% y/y (1.2 standard deviations below average since 2020). Roughly 18% of Americans sell, build, fix, lend to, and furnish homes – velocity matters for the economy. See Fig 7-10.
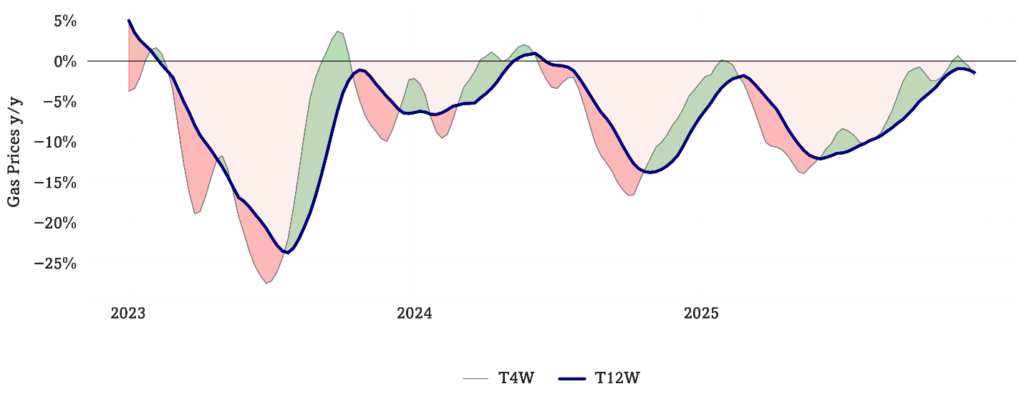
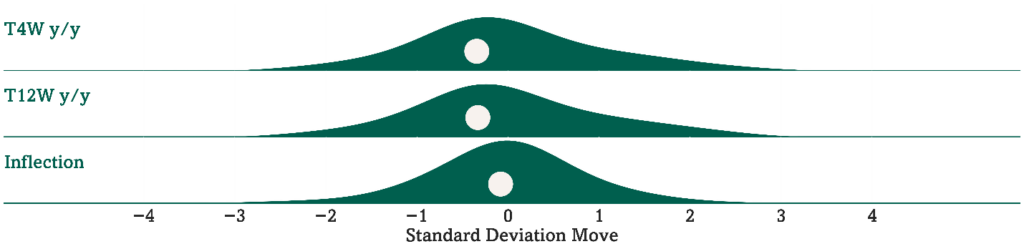
Gasoline prices down slightly y/y. Gas prices ran down -1.8% y/y on a T4W basis, after briefly turning positive y/y following 41 consecutive weeks of y/y declines through early November, and declined -1.4% y/y on a T12W y/y basis, corresponding to a -0.4% inflection between shorter and longer-term trends (approximately average relative to historical trends), the first week of negative inflections following 18th consecutive weeks of positive inflections. See Fig 11-12.
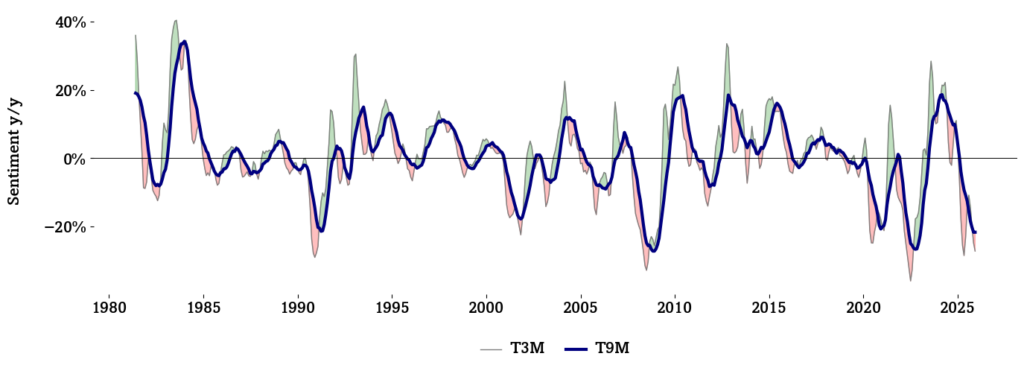
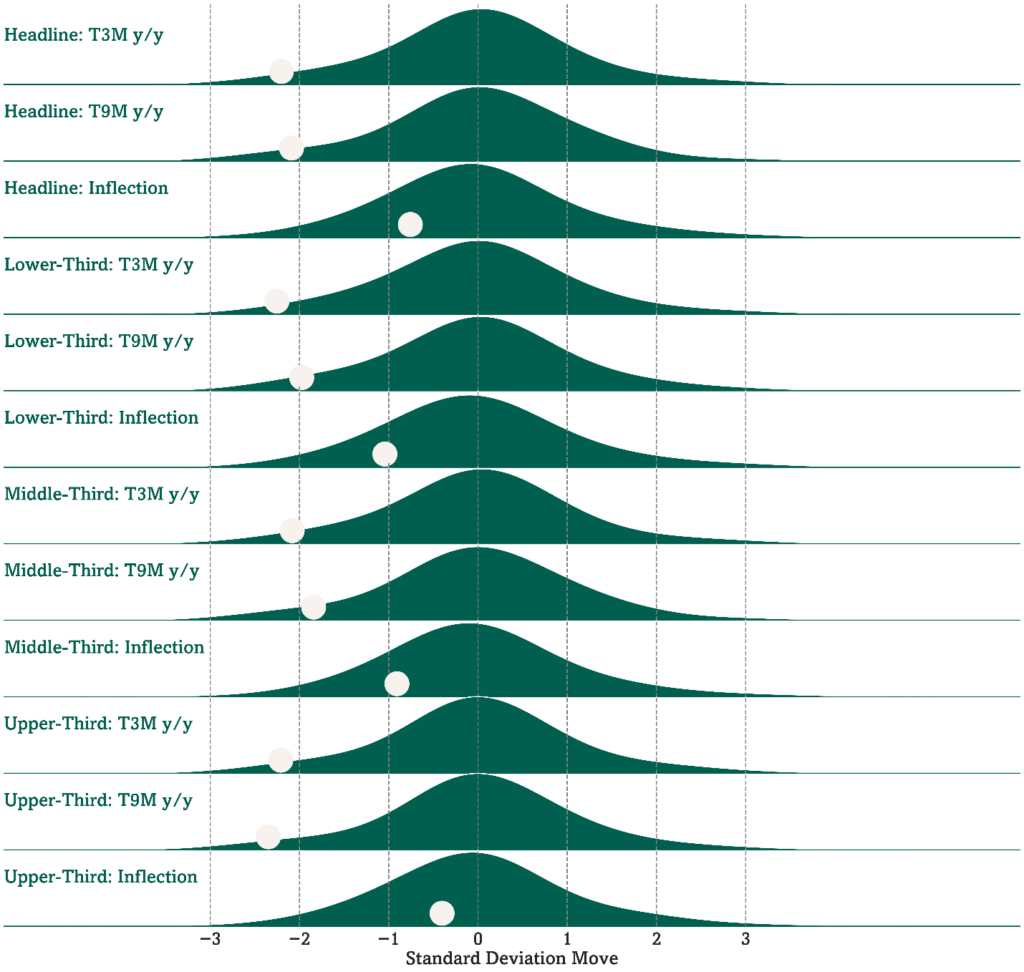
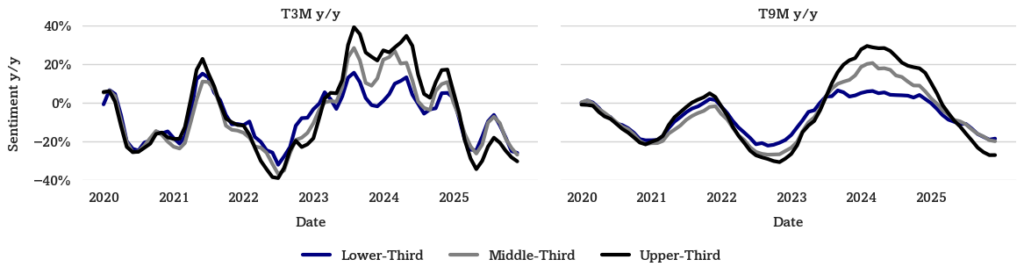
Consumer Sentiment has now spent 3 months measurably below 2008 troughs and at the lowest level since monthly metrics started in 1978! Both magnitude and duration of change matter – we note that may be “what is different this time” as Sentiment drops have historically healed rapidly enough so as not to impact consumer spending. Headline Sentiment has declined -27% y/y on a T3M basis (2.2 standard deviations below average) and -22% y/y on a T9M basis (2.1 standard deviations below average), marking the first month since late 2024 and second month since early 2024 where longer-term Sentiment y/y did not decrease from the prior month. Upper-third income Sentiment has declined -30% y/y on a T3M basis (2.2 standard deviations below average), middle-income Sentiment has declined -27% y/y on a T3M basis (2.1 standard deviations below average), and lower-income Sentiment has declined -26% y/y on a T3M basis (2.3 standard deviations below average). See Fig 13-16.
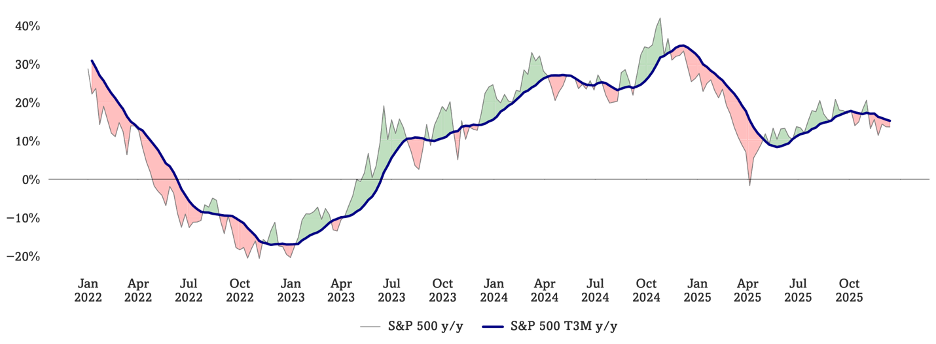
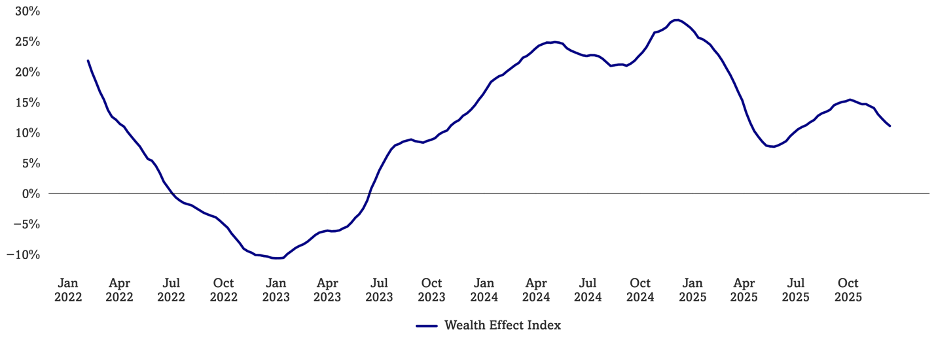
Consumer Wealth Effect Index has been softening in recent weeks, currently at average level. Optimal Advisory’s Wealth Effect Index is currently at 11.1% y/y (0.0 standard deviations above its mean value since the start of 2022) after peaking at 15.4% in early October. See Fig 17-20.
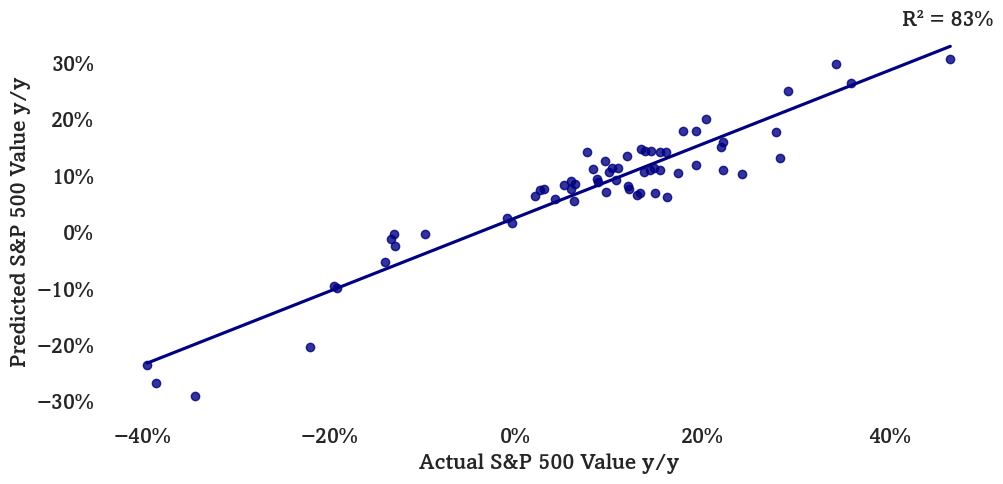
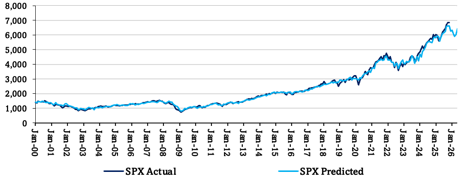
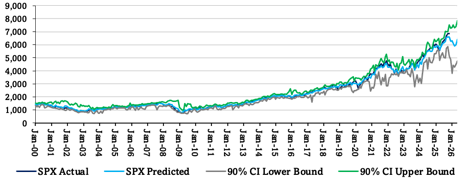
Multifactor Macro Market Model suggesting downturn, rebound. Optimal’s Multifactor Macro Market Model projects the S&P 500 as well as bull and bear cases based on lagged data for 12 macroeconomic factors. The model suggests the S&P 500 to fall to just below 6000 by next March, before rebounding back up to 6400 by May. See Fig 21-23.
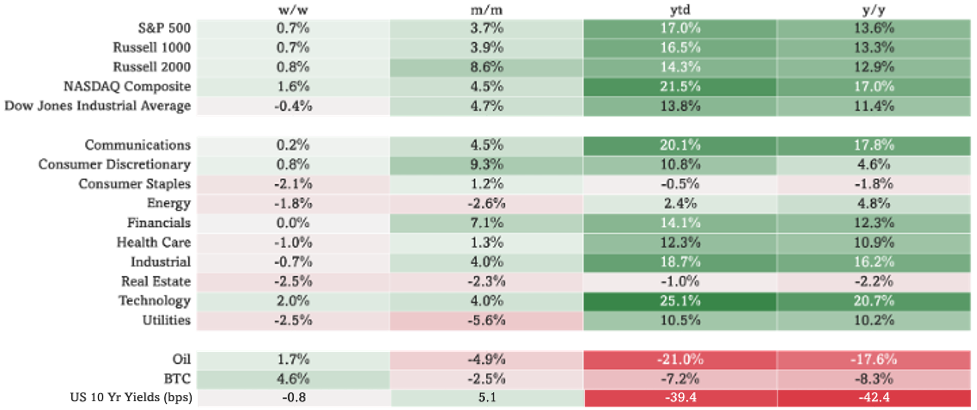
In this weekly note, we focus on key changes in the US consumer’s real-time dynamics (70% of the US economy). We also calculate and present the extent to which current dynamics are “non-normal”, relative to historic patterns. See Fig 24 for sector market performance.
Figures 1-2: Optimal Advisory Consumer Velocity Monitor
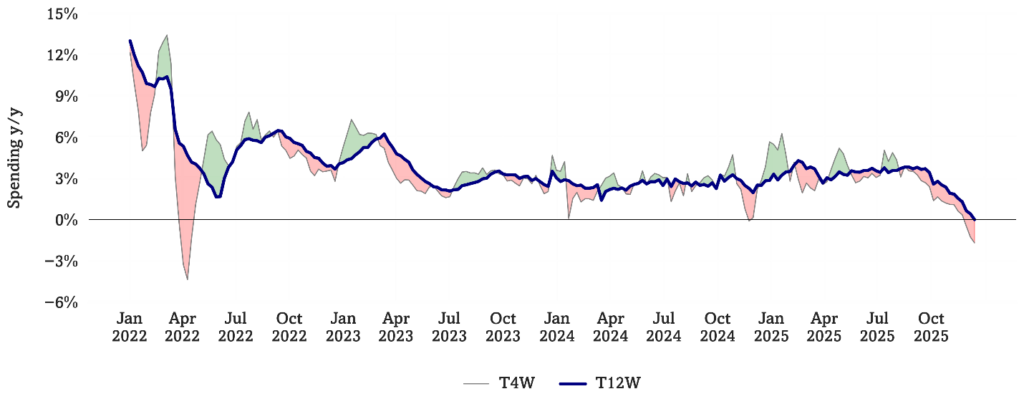
Source: Optimal Advisory Analysis, Bloomberg Second Measure
Consumer Spending y/y Relative to Historical Average
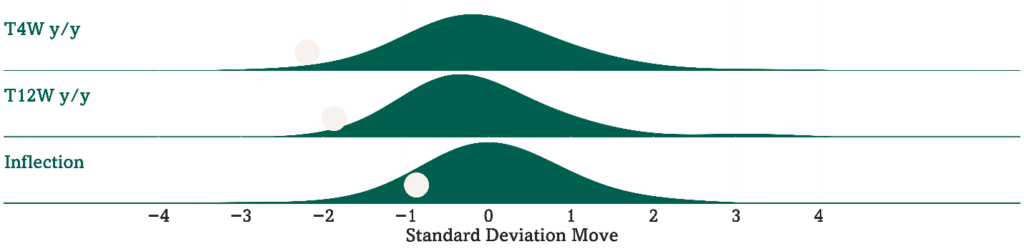
Source: Optimal Advisory Analysis, Bloomberg Second Measure
Figures 3-6: Optimal Advisory Premium vs Value Monitor
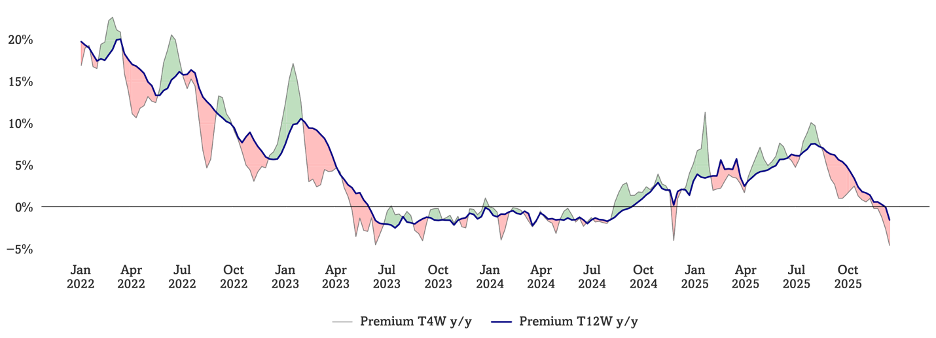
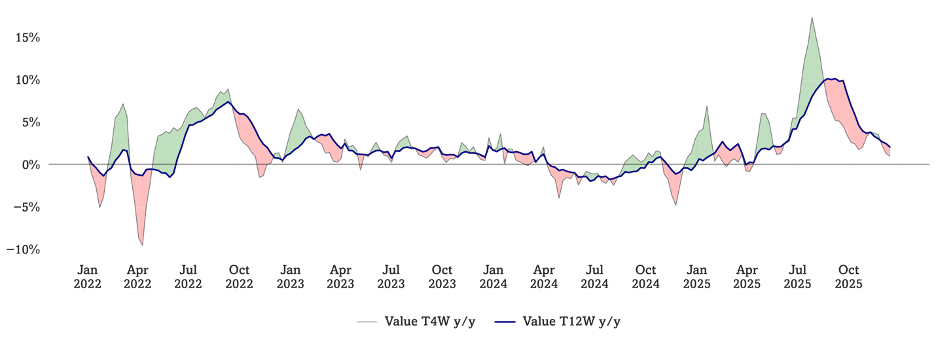
Source: Optimal Advisory Analysis, Bloomberg Second Measure, Google Trends
Optimal Advisory Premium vs Value Indices Relative to Historical Averages
Source: Optimal Advisory Analysis, Bloomberg Second Measure, Google Trends
Figures 7-10: Housing Kinetic Energy
Source: Optimal Advisory Analysis, Freddie Mac, Zillow, Redfin
Mortgage Rates, For Sale Inventory, & Median List Price y/y Relative to Historical Averages (Since 2020)
Source: Optimal Advisory Analysis, Freddie Mac, Zillow, Redfin
Figures 11-12: Gas Prices y/y
Source: Optimal Advisory Analysis, U.S. Energy Information Administration
Gas Prices y/y Relative to Historical Averages (Since 1992)
Source: Optimal Advisory Analysis, U.S. Energy Information Administration
Figures 13-16: Consumer Sentiment T3M and T9M y/y
Source: Optimal Advisory Analysis, University of Michigan Consumer Survey
Sentiment y/y by Income Tercile Relative to Historical Averages
Source: Optimal Advisory Analysis, University of Michigan Consumer Survey
Comparison of Sentiment y/y Across Income Terciles
Source: Optimal Advisory Analysis, University of Michigan Consumer Survey
Figures 17-20: Consumer Wealth Effect & Components y/y
Source: Optimal Advisory Analysis, Bloomberg, Zillow, Redfin
Median Home Price y/y, S&P 500 y/y, & Wealth Effect Index (Since 2022)
Source: Optimal Advisory Analysis, Bloomberg, Zillow, Redfin
Figures 21-23: Optimal Advisory Multifactor Macro Market Model
Historical Test Predictions vs. Actual (On Test Data Only)
Sources: Optimal Advisory Proprietary Analysis, Bloomberg, FRED, BLS, BEA, OECD, University of Michigan Consumer Sentiment Survey, U.S. Census Bureau, FRB
Actual & Projected S&P 500 (Including Training & Test Data)
Sources: Optimal Advisory Proprietary Analysis, Bloomberg, FRED, BLS, BEA, OECD, University of Michigan Consumer Sentiment Survey, U.S. Census Bureau, FRB
Actual & Projected S&P 500 with Confidence Intervals
Sources: Optimal Advisory Proprietary Analysis, Bloomberg, FRED, BLS, BEA, OECD, University of Michigan Consumer Sentiment Survey, U.S. Census Bureau, FRB
Figure 24: Index & Sector Performance
Source: Optimal Advisory Analysis, Bloomberg, prices intraday 12/22/2025