Cost Relief Helping CPG, Restaurant Outlooks While Perishable Declines Hurt Retailer Comp. Inputs -2.0% w/w, -10.9% y/y. Friday Cost Factor
Optimal Advisory Cost Factor – Another sharp w/w drop in critical input prices , the Optimal Cost Factor down this week (-2.0%) and down sharply (-10.9%) versus last year.
TLDR — lower Input costs do a few things:
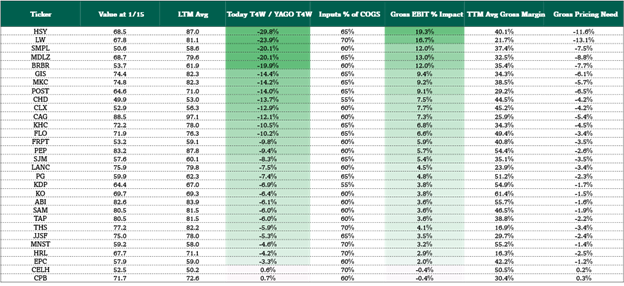
- Give a measurable H1 EPS tailwind to otherwise challenged CPG companies relative to planning period (early fall) expectations. See Fig 2.
- Help restaurant margins and/or provide fuel for promotional spend.
- Enhance center store grocery wallet through lower perishables spend (e.g. milk, meat, eggs), where input costs pass through directly.
- Challenge H1 2026 grocery comp both in perishables (cf. ACI guide last week) and stoking “select” price cuts (e.g. private label) as they chase traffic.
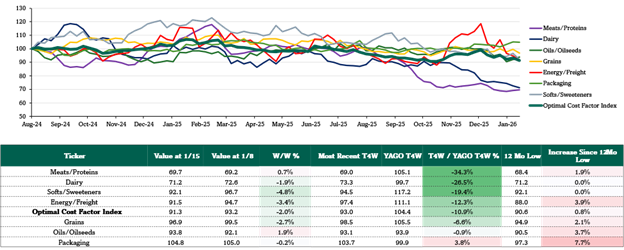
Cost Factor -2.0% w/w, -10.9% y/y (vs. prior week +0.8% w/w & -9.0% y/y). Commodity tailwinds expanding this week beyond energy. Natural gas continues to work lower (-8% w/w, down -20.8% y/y). See Fig 3.
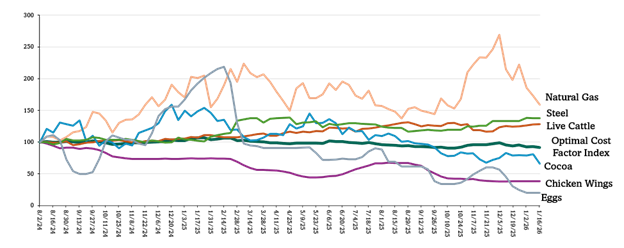
- Cocoa dropped -18.3% this week (down -55.6% y/y) to a 2 year low on favorable weather forecasts in West Africa. MDLZ has cited higher supply as well.
- Grains were lower this week as both oats and corn prices are down w/w and remain down y/y.
- Both grains (-2.7%) and energy/freight (-3.4%) prices dropped this week, which tend to be leading indicators of broader input commodity trends.
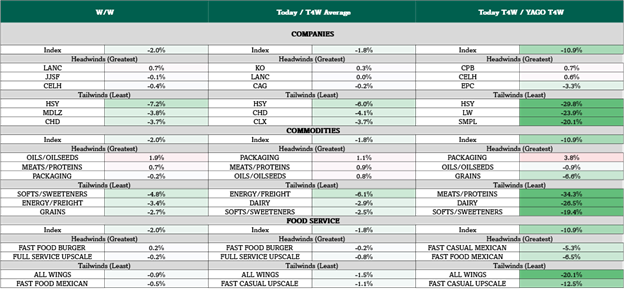
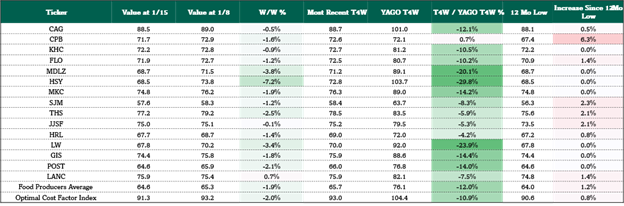
Cost tailwinds to watch: Meats/Proteins down -34.3% y/y, HSY -29.8% y/y, LW -23.9% y/y, Wing restaurants -20.1% y/y. See Fig 1.
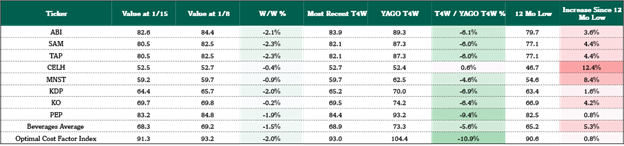
Cost headwinds to watch: Oil/oilseeds (+1.9% w/w, -0.9% y/y), CPB +0.7% y/y, CELH +0.6% y/y. See Fig 1.
In this weekly note, we identify spot input costs’ putative impact on the U.S. fast moving consumer goods (FMCG) value chain, most measurably impacting staples, staples retailers, restaurants & food service. Optimal’s proprietary cost factor weights ticker & sector specific cost trends using a proprietary formula based on 32 trackable spot cost inputs – 23 of which are updated as of last night, the other 9 are latest available.
Figure 1: Weekly Cost Factor Summary
Sources: Optimal Advisory Proprietary Analysis, Bloomberg, FRED, USDA, BEA
Figure 2: Weekly Cost Factor Margin Context
Sources: Optimal Advisory Proprietary Analysis, Bloomberg, FRED, USDA, BEA
Figure 3: Weekly Input Commodity Performance by Group
Sources: Optimal Advisory Proprietary Analysis, Bloomberg, FRED, USDA, BEA
Figure 4: Biggest Input Cost Movers y/y
Sources: Optimal Advisory Proprietary Analysis, Bloomberg, FRED, USDA, BEA
Figure 5: Food Sector Cost Factor
Sources: Optimal Advisory Proprietary Analysis, Bloomberg, FRED, USDA, BEA
Figure 6: Beverage Sector Cost Factor
Sources: Optimal Advisory Proprietary Analysis, Bloomberg, FRED, USDA, BEA
Figure 7: HPC Sector Cost Factor

Sources: Optimal Advisory Proprietary Analysis, Bloomberg, FRED, USDA, BEA
Figure 8: Restaurant Level Cost Factor

Sources: Optimal Advisory Proprietary Analysis, Bloomberg, FRED, USDA, BEA
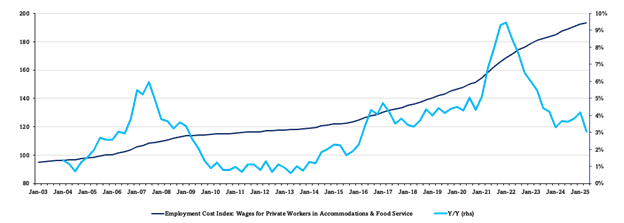
Figure 9: Restaurant Employment Cost Index
Sources: Optimal Advisory Proprietary Analysis, Bloomberg, FRED, USDA, BEA
Figure 10: Staples Sector Theme Box
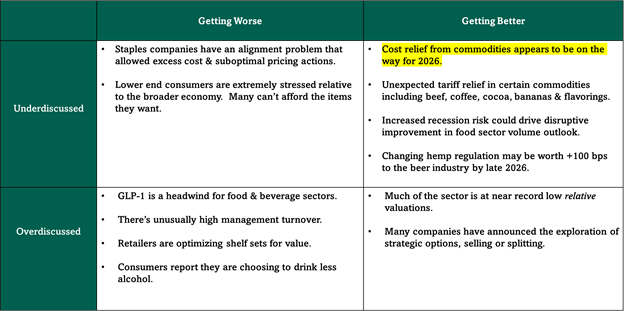
Figure 11: Market Sector Performance
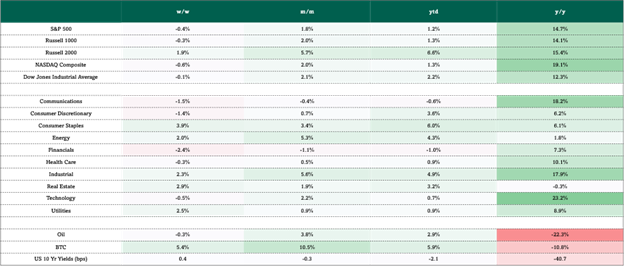
Sources: Optimal Advisory Proprietary Analysis, Bloomberg