Dairy, Egg, Meat Declines Hit Retailer Comp Outlook. FMCG Value Chain Input Costs Up 0.8% w/w, -1.9% y/y. Friday Cost Factor
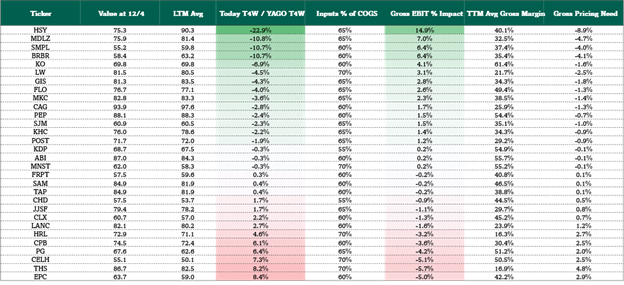
HSY, MDLZ lead beneficiaries of cost relief on cocoa. FMCG spot input costs down -1.9% y/y overall, -2.4% y/y for food producers. Energy and freight (nat gas +4.5% w/w, +16.3% m/m) remain offsetting headwinds (e.g. factories, packaging) to most.
Eggs, chicken, pork & dairy are broadly deflationary – challenging headline sales for all food retailers (KR, ACI, SFM, etc). On its 12/4 EPS Call, KR interim CEO Ronald Sargent called out “lapping egg inflation last year that we won’t see this year.”
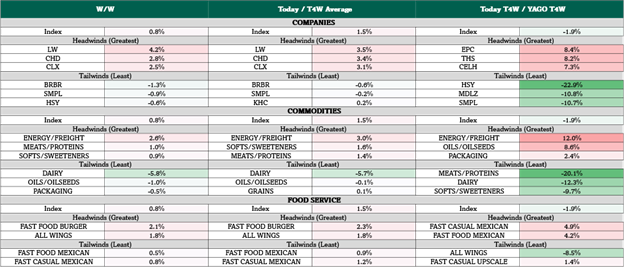
Optimal Cost Factor +0.8% w/w, -1.9% y/y (vs. prior week +1.9% w/w & -2.2% y/y). We note sustained y/y commodity headwinds from energy/freight & beef with y/y declines in almost everything else. We note slight easing in that trend this week with 24/30 companies and 6/6 food service categories in our coverage with an increase w/w in their weighted cost exposure. See Fig 1-7.
Cost index tailwinds to watch: HSY (-22.9% y/y), BRBR (-1.3% w/w, -10.7% y/y), Dairy (-5.8 w/w, -12.3% y/y), Wing Restaurants (-8.5%)
Cost index headwinds to watch: EPC (+8.4% y/y), THS (+8.2% y/y), Energy/Freight (+2.6% w/w, +12.0% y/y)
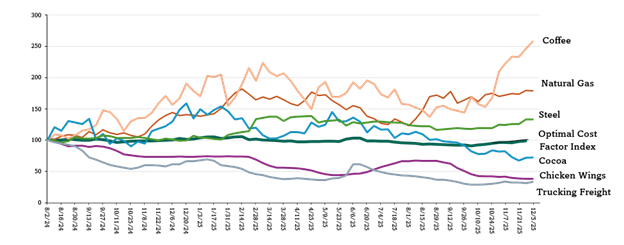
Input commodity tailwinds to watch: Dairy (-5.8% w/w, -12.3% y/y), Cheese (-5.1% w/w, -17.9% y/y), Milk (-6.5% w/w, -14.8% y/y)
Input commodity headwinds to watch: Natural Gas (+4.5% w/w, +64.8% y/y)
In this weekly note, we identify spot input costs’ putative impact on the U.S. fast moving consumer goods (FMCG) value chain, most measurably impacting staples, staples retailers, restaurants & food service. Optimal’s proprietary cost factor weights ticker & sector specific cost trends using a proprietary formula based on 32 trackable spot cost inputs – 23 of which are updated as of last night, the other 9 are latest available.
Figure 1: Weekly Cost Factor Summary
Sources: Optimal Advisory Proprietary Analysis, Bloomberg, FRED, USDA, BEA
Figure 2: Weekly Cost Factor Margin Context
Sources: Optimal Advisory Proprietary Analysis, Bloomberg, FRED, USDA, BEA
Figure 3: Weekly Input Commodity Performance by Group

Sources: Optimal Advisory Proprietary Analysis, Bloomberg, FRED, USDA, BEA
Figure 4: Biggest Input Cost Movers y/y
Sources: Optimal Advisory Proprietary Analysis, Bloomberg, FRED, USDA, BEA
Figure 5: Food Sector Cost Factor

Sources: Optimal Advisory Proprietary Analysis, Bloomberg, FRED, USDA, BEA
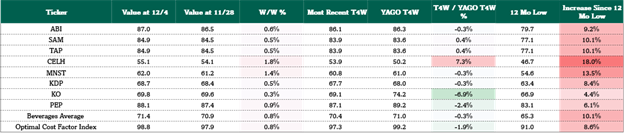
Figure 6: Beverage Sector Cost Factor
Sources: Optimal Advisory Proprietary Analysis, Bloomberg, FRED, USDA, BEA
Figure 7: HPC Sector Cost Factor

Sources: Optimal Advisory Proprietary Analysis, Bloomberg, FRED, USDA, BEA
Figure 8: Restaurant Level Cost Factor

Sources: Optimal Advisory Proprietary Analysis, Bloomberg, FRED, USDA, BEA
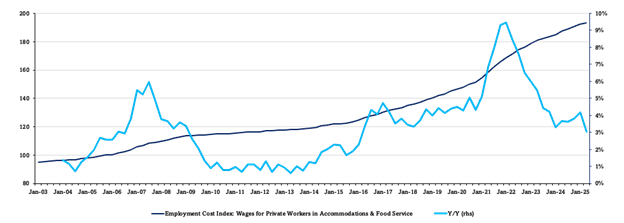
Figure 9: Restaurant Employment Cost Index
Sources: Optimal Advisory Proprietary Analysis, Bloomberg, FRED, USDA, BEA
Figure 10: Staples Sector Theme Box
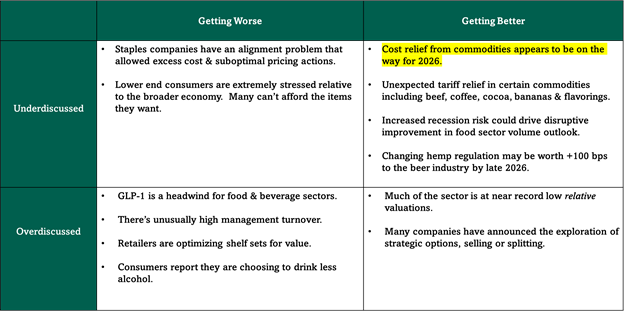
Figure 11: Market Sector Performance

Sources: Optimal Advisory Proprietary Analysis, Bloomberg