“Deck The Halls with Costs Falling” – Biggest Gifts for KDP, HSY, MDLZ, Food Sector & Wing Restaurants. Cost Factor -1.7% w/w, -4.1% y/y. Friday Cost Factor
Optimal Advisory Cost Factor – All measured Tickers and Industry Indices down w/w as input costs move lower. Steep declines in energy cost over the last 2 weeks are outweighing bottoming in other input commodities.
Biggest surprise gift? Arabica Coffee declined sharply (-14.8% w/w) on potentially improved coffee supply from Brazil. (+: KDP, SBUX, SJM)
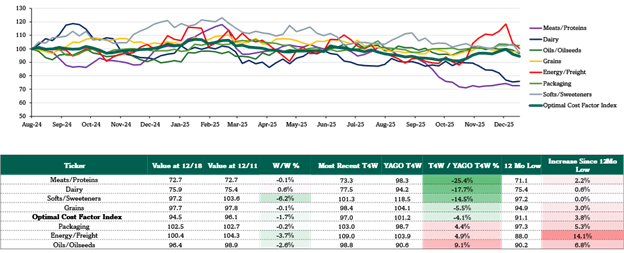
Cost Factor -1.7% w/w, -4.1% y/y (vs. prior week -3.5% w/w & -2.7% y/y). Besides tailwinds in energy input costs, the greatest w/w decline in commodity prices came from Softs/Sweeteners (down -6.2% w/w, down -14.5% y/y) as coffee prices sharply lower (still +56.3% for year but See Figs 1-8.
Energy costs down for 2nd week in a row on forecasts for warmer US weather and buildup of natural gas supply. After hitting a three-year in early December, natural gas prices are down -15% m/m (from T12M peak of $5.29 USD/MMBtu to $3.89 USD/MMBtu this week). Virtually every major input cost (e.g. factories, freight, packaging) outside the food chain is tied to energy. See Figs 4-7.
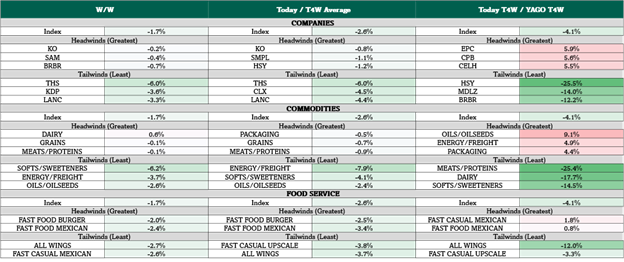
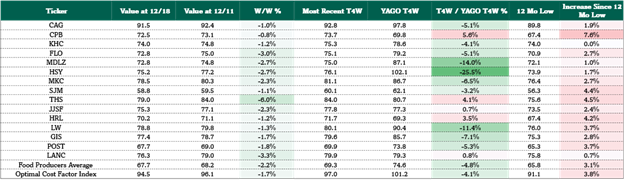
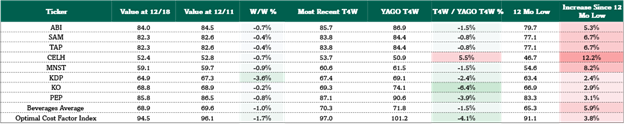
Cost tailwinds to watch: THS (-6.0% w/w), KDP (-3.6% w/w) suddenly with short term cost tailwinds due to select input commodity exposure. See Fig 1.
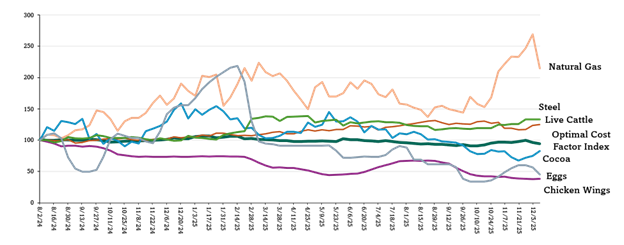
Commodity Inflections to watch. Eggs and Cocoa have been 2 of the largest cost tailwinds for staples companies this year. Eggs now running down -24.3% m/m and down -70.9% y/y, while cocoa prices running up +16.7% m/m but still down -50.4% y/y. See Fig 4.
Cost headwinds to watch: Dairy (+0.6% w/w, -17.7% y/y), Oil/Oilseeds (+9.1% y/y), EPC (+5.9% y/y). See Fig 1.
In this weekly note, we identify spot input costs’ putative impact on the U.S. fast moving consumer goods (FMCG) value chain, most measurably impacting staples, staples retailers, restaurants & food service. Optimal’s proprietary cost factor weights ticker & sector specific cost trends using a proprietary formula based on 32 trackable spot cost inputs – 23 of which are updated as of last night, the other 9 are latest available.
Figure 1: Weekly Cost Factor Summary
Sources: Optimal Advisory Proprietary Analysis, Bloomberg, FRED, USDA, BEA
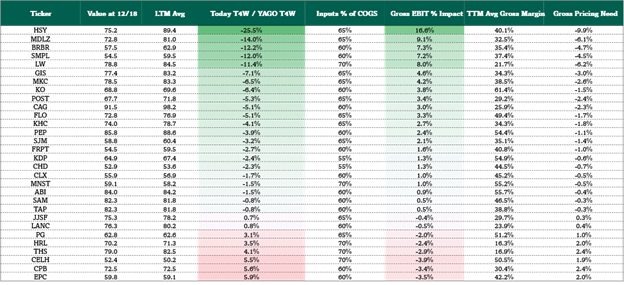
Figure 2: Weekly Cost Factor Margin Context
Sources: Optimal Advisory Proprietary Analysis, Bloomberg, FRED, USDA, BEA
Figure 3: Weekly Input Commodity Performance by Group
Sources: Optimal Advisory Proprietary Analysis, Bloomberg, FRED, USDA, BEA
Figure 4: Biggest Input Cost Movers y/y
Sources: Optimal Advisory Proprietary Analysis, Bloomberg, FRED, USDA, BEA
Figure 5: Food Sector Cost Factor
Sources: Optimal Advisory Proprietary Analysis, Bloomberg, FRED, USDA, BEA
Figure 6: Beverage Sector Cost Factor
Sources: Optimal Advisory Proprietary Analysis, Bloomberg, FRED, USDA, BEA
Figure 7: HPC Sector Cost Factor

Sources: Optimal Advisory Proprietary Analysis, Bloomberg, FRED, USDA, BEA
Figure 8: Restaurant Level Cost Factor

Sources: Optimal Advisory Proprietary Analysis, Bloomberg, FRED, USDA, BEA
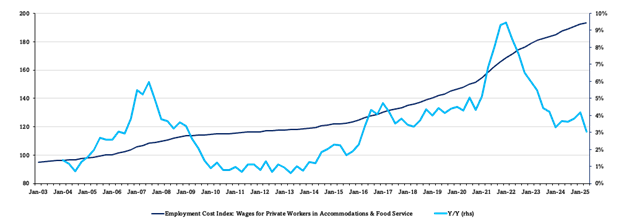
Figure 9: Restaurant Employment Cost Index
Sources: Optimal Advisory Proprietary Analysis, Bloomberg, FRED, USDA, BEA
Figure 10: Staples Sector Theme Box
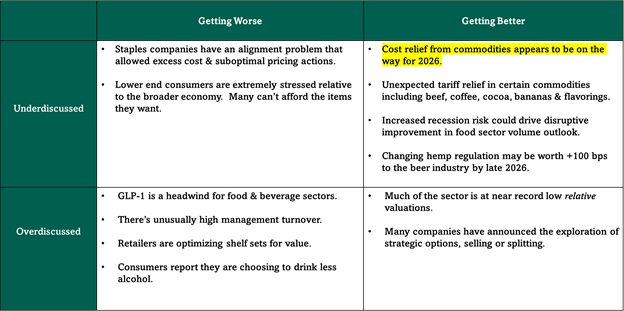
Figure 11: Market Sector Performance
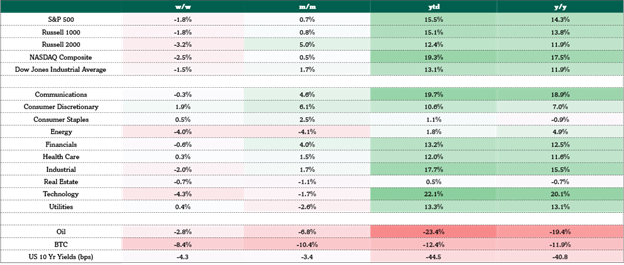
Sources: Optimal Advisory Proprietary Analysis, Bloomberg