Gas Spend Cannibalization Showing Up; Housing Standstill Math; Wealth Effect Pressures: Macro Monday
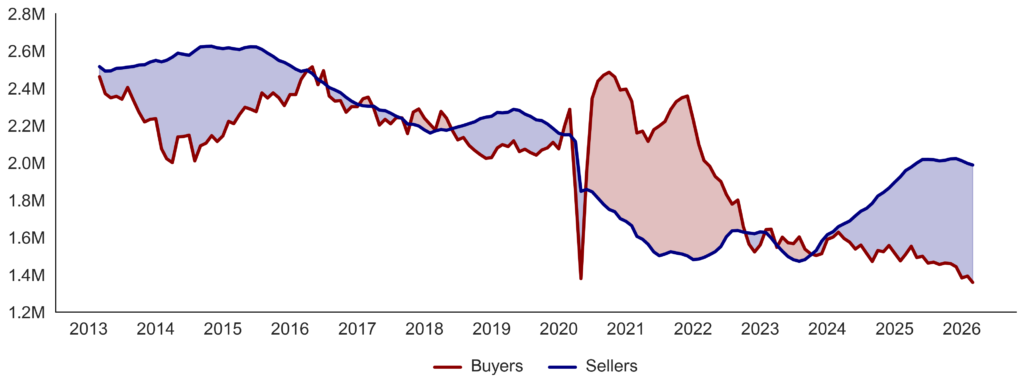
This Week in Macro / TWIM Notes … (1) late March gas station spending is measurably eating into overall spend versus a month ago (gas station spending up 25%+ y/y, cannibalization remarkably about half of spending growth) and last week our Consumer Discretionary Briefing Book showed incremental weakness in luxury, pizza, and other categories; and (2) the 40 bp increase in 30Y mortgage rates in March is worsening the “lock-in” effect of historically extremely few homes for sale, now running about 50% below a decade ago (see chart below).
Housing Seller v Buyers Spread Notable
Source: Optimal Advisory Analysis, Redfin analysis of MLS data
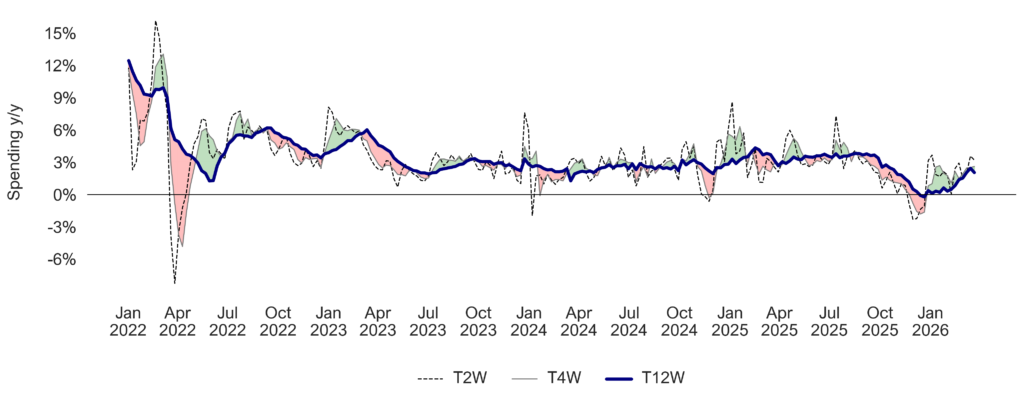
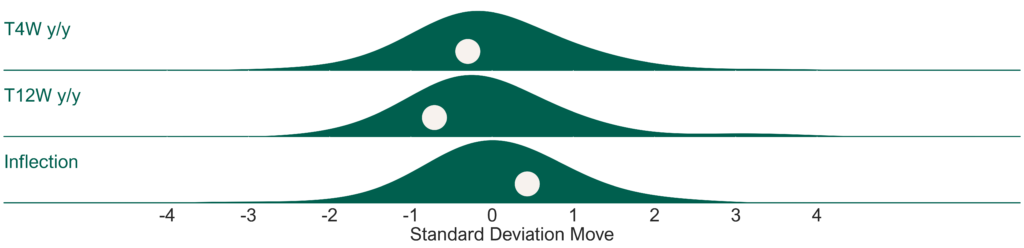
So far consumer spend hasn’t changed much in aggregate yet … our overall tracker trend is fairly stable. Our Consumer Velocity tracker remained positive but muted, running up +2.6% y/y T4W, softer than 3Q25. This metric was running -1.6% y/y in mid-December but was up +3-4% in 3Q25. Gas station spending is now running up 25-30% y/y and represents approximately 5% of our index (as it does of consumer spending) – so about 125-150 bp of 260 bp of y/y spending growth is happening at gas stations. In February, as a comparison, gas station spending was inline with overall spending. The trailing Consumer Velo 12-week trend is up +2.0% y/y (0.7 standard deviations below average) vs. +2.4% y/y the prior week, leading to a +0.6% shorter vs. longer-term inflection (0.4 standard deviations above average). See Fig 1-2.
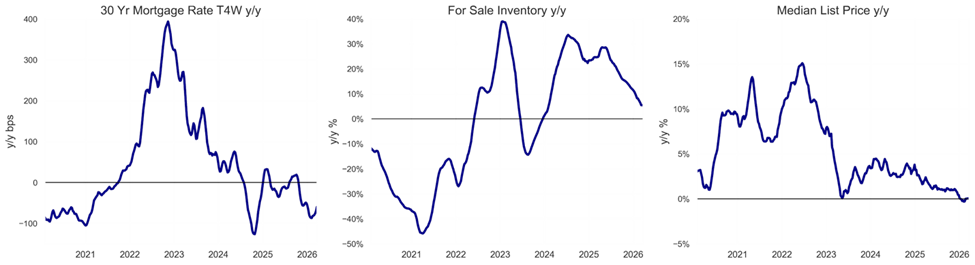
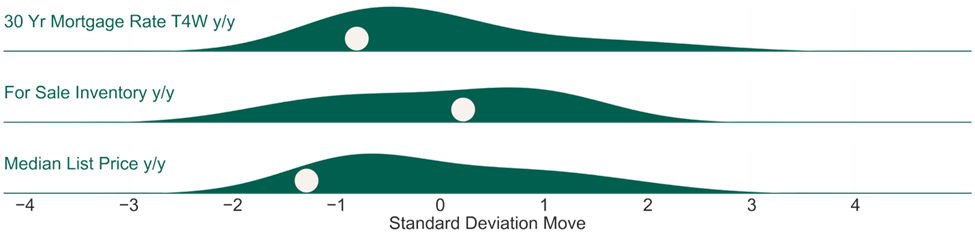
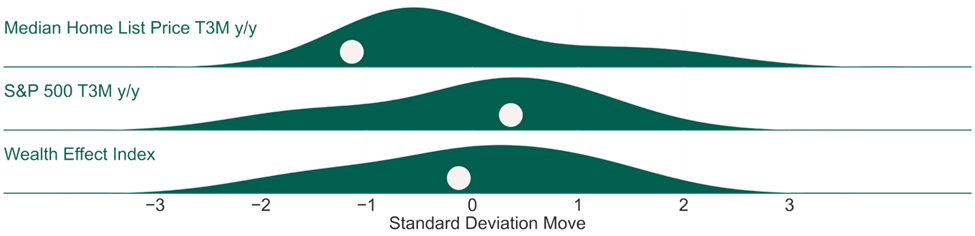
Housing potential & kinetic energy is significantly softer as mortgage rates / bond markets have been pressured higher by oil inflation. US 30Y FRM rate have moved higher the last 4 weeks, now running down only -60 bps y/y on a T4W basis (0.8 standard deviations below average since 2020). MBA’s mortgage applications for purchase continue to run up +5% y/y while refinance applications running up +52% (a low base, but a necessary step to create eventual velocity). Median home prices are flat y/y (-1.3 standard deviations below average since 2020). Roughly 18% of Americans sell, build, fix, lend to, and furnish homes – velocity matters for the economy. See Fig 3-6.
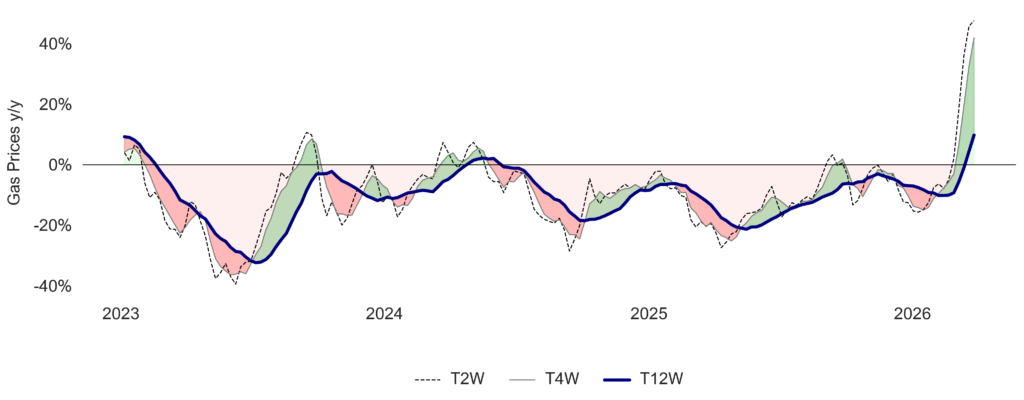
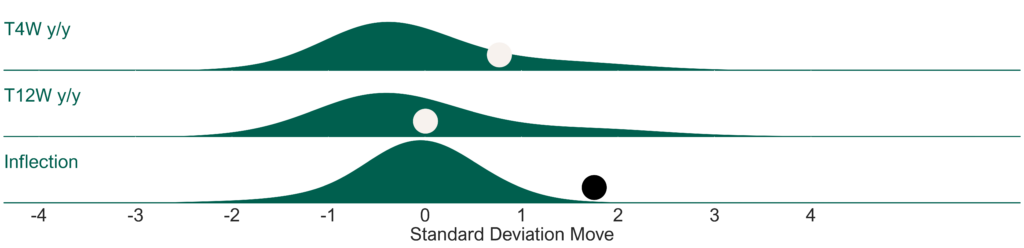
Gasoline inflation is now +45.4% y/y for the week ending last Friday following +49.7% the week prior and +41.5% two weeks ago. Gas prices ran up +41.9% y/y on a T4W basis and +9.7% y/y on a T12W basis. It is worth noting US discretionary consumer comp store sales broadly decelerated only after gas y/y prices were +30% in the fall of 2007 (though we do note that $104 WTI crude today is not the same real dollar impact as $114 in 2022 or $140 in 2008). But at the end of the day our analysis of, and experience with, prior slowdowns driven by external macro stimuli suggests gas price inflation of 30%+ y/y begins to impact discretionary spending after about 6-8 weeks. Duration and magnitude of impacts matter. Gas stations started to see a spike in spending around March 7th. Generally, lower-income consumers spend about 5% of their total spend on fuel, and higher-income consumers spend about 2.5% – so a 10% move in gas prices drives 25-50 bp headwind or tailwind. Utilities (electricity and heating fuel) run from about 9% of lower-income household spending to 4% for higher-income households. Duration of change matters – eventually causing Consumer Sentiment shifts, which then drive more or less discretionary spending. See Fig 7-8.
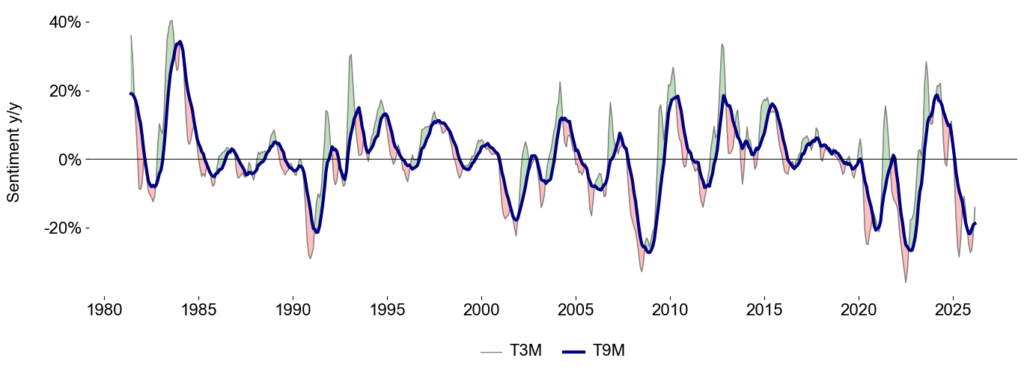
Sentiment is very weak (at 53.3 right now compared to lowest ever number at 50) but is lapping very weak comparisons. Overall, headline Sentiment is down -6% y/y and -14% y/y on a T3M basis (1.1 standard deviations below average) and -19% y/y on a T9M basis (1.8 standard deviations below average). This compares to -13% y/y on last month, marking the third consecutive month where y/y Sentiment declines improved from the prior month. Upper-third income Sentiment has declined -12% y/y on a T3M basis (0.9 standard deviations below average), after declining -22% y/y T3M last month. Middle-income Sentiment has declined -13% y/y on a T3M basis (1.0 standard deviations below average) compared to -19% last month, and lower-income Sentiment has declined -17% y/y on a T3M basis (1.4 standard deviations below average) compared to -22% last month. See Fig 9-12.
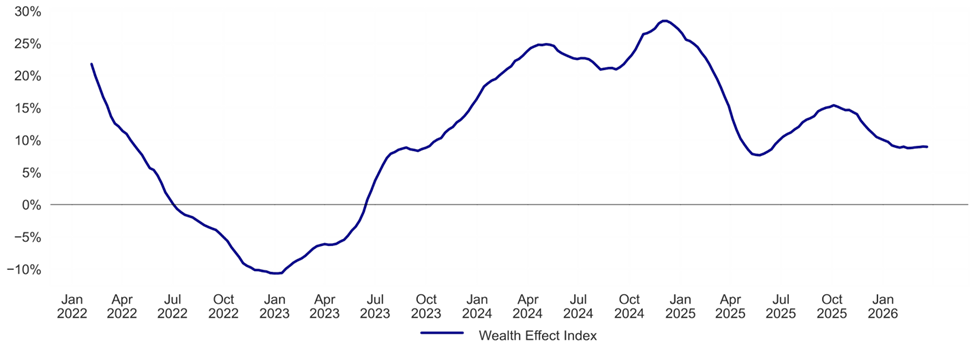
Consumer Wealth Effect Index is 600 bp below 3Q25 levels – a drag on Premium mindset. Optimal Advisory’s Wealth Effect Index is at +8.9% y/y (0.1 standard deviations below average since the start of 2022). This metric was running +15.4% y/y in October 2025. With home prices flat y/y and equity returns more volatile in recent weeks we note the “flywheel” of wealth effect is more muted. See Fig 13-16.
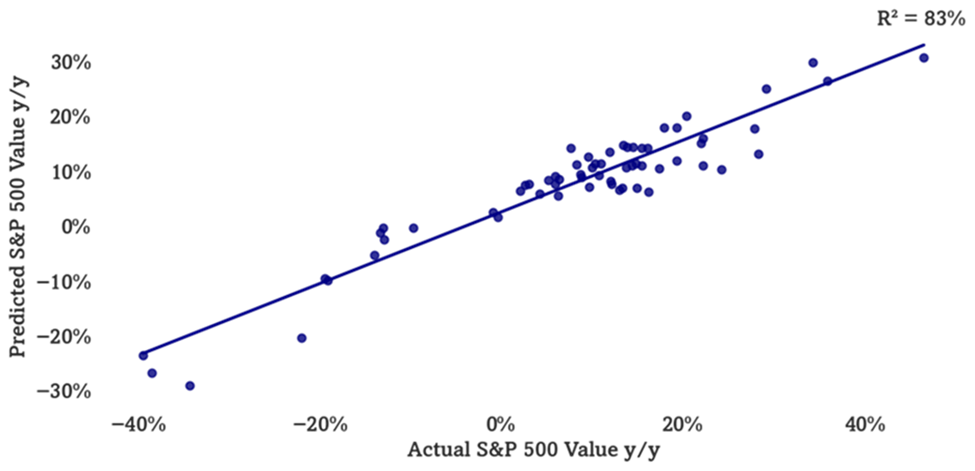
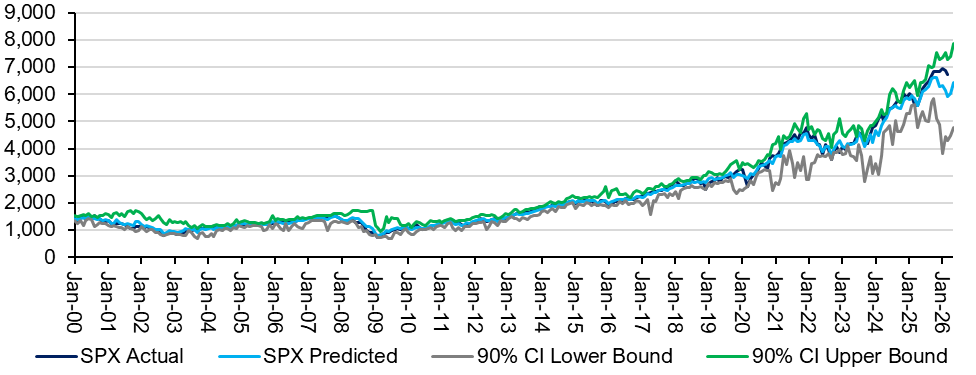
Multifactor Macro Market Model has been suggestive of March 2026 softness, rebound. Optimal’s Multifactor Macro Market Model projects the S&P 500 as well as bull and bear cases based on lagged data for 12 macroeconomic factors. The model has suggested the S&P 500 to fall to just below 6000 by this month, before rebounding back up to 6400 by May. We use this model as a guide to how macro would guide the market, given our analysis of current variables. This is, of course, outside of other factors at work. See Fig 17-18.
Figures 1-2: Optimal Advisory Consumer Velocity Monitor
Source: Optimal Advisory Analysis, Bloomberg Second Measure
Consumer Spending y/y Relative to Historical Average
Source: Optimal Advisory Analysis, Bloomberg Second Measure
Figures 3-6: Housing Kinetic Energy
Source: Optimal Advisory Analysis, Freddie Mac, Zillow, Redfin
Mortgage Rates, For Sale Inventory, & Median List Price y/y Relative to Historical Averages (Since 2020)
Source: Optimal Advisory Analysis, Freddie Mac, Zillow, Redfin
Figures 7-8: Gas Prices y/y
Source: Optimal Advisory Analysis, Bloomberg
Gas Prices y/y Relative to Historical Averages (Since 1992)
Source: Optimal Advisory Analysis, Bloomberg
Figures 9-12: Consumer Sentiment T3M and T9M y/y
Sentiment y/y by Income Tercile Relative to Historical Averages
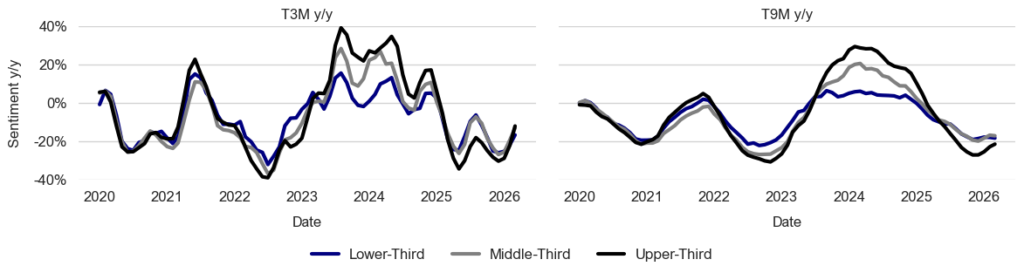
Comparison of Sentiment y/y Across Income Terciles
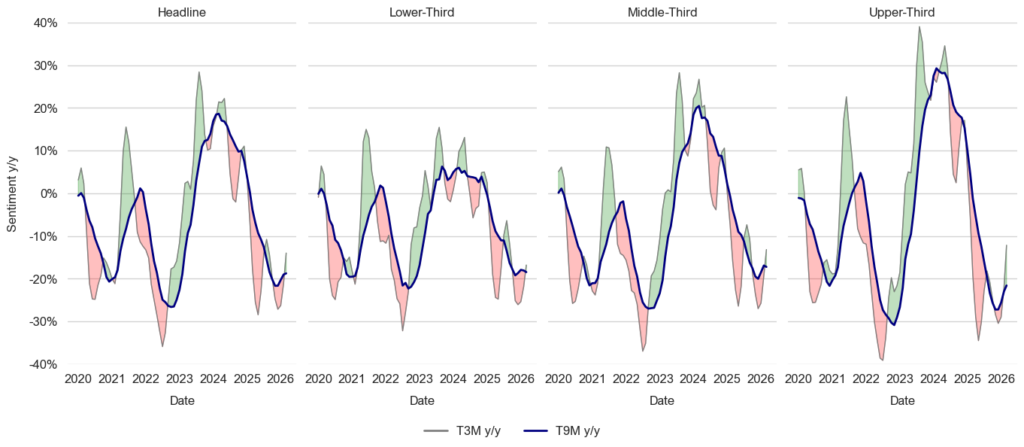
Source: Optimal Advisory Analysis, University of Michigan Consumer Survey
Figures 13-16: Consumer Wealth Effect & Components y/y
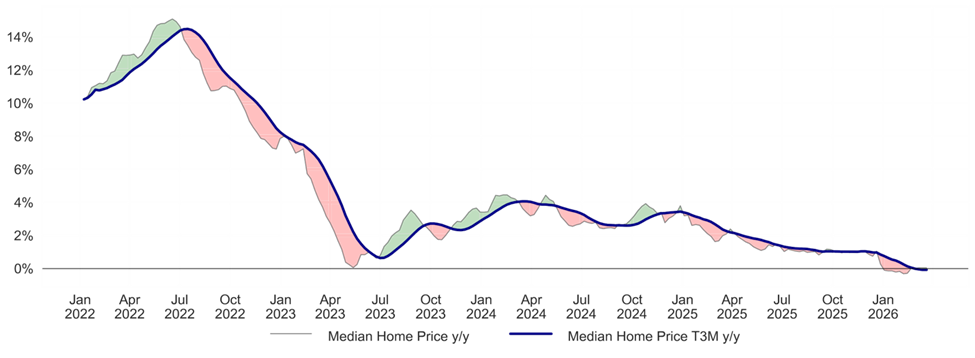
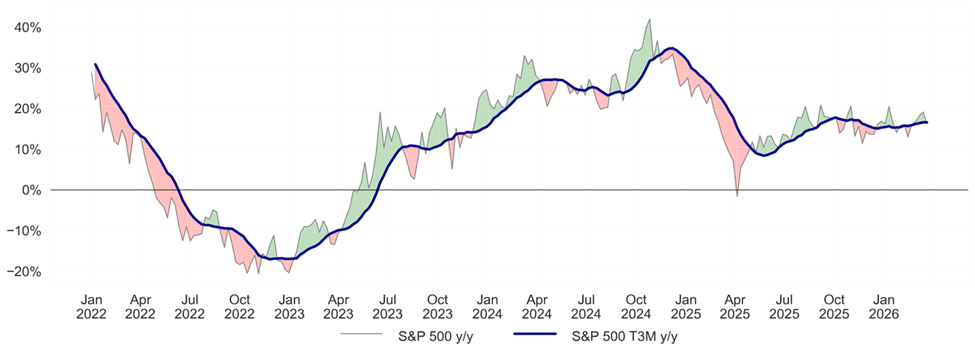
Source: Optimal Advisory Analysis, Bloomberg, Zillow, Redfin
Median Home Price y/y, S&P 500 y/y, & Wealth Effect Index (Since 2022)
Source: Optimal Advisory Analysis, Bloomberg, Zillow, Redfin
Figures 17-18: Optimal Advisory Multifactor Macro Market Model
Historical Test Predictions vs. Actual (On Test Data Only)
Source: Optimal Advisory Proprietary Analysis, Bloomberg, FRED, BLS, BEA, OECD, University of Michigan Consumer Sentiment Survey, U.S. Census Bureau, FRB
Actual & Projected S&P 500 (Including Training & Test Data) with Confidence Intervals
Source: Optimal Advisory Proprietary Analysis, Bloomberg, FRED, BLS, BEA, OECD, University of Michigan Consumer Sentiment Survey, U.S. Census Bureau, FRB
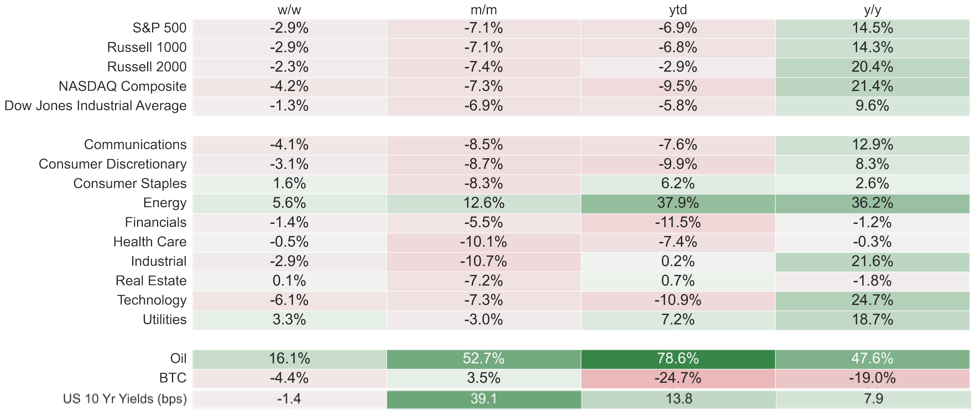
Figure 19: Index & Sector Performance
Source: Optimal Advisory Analysis, Bloomberg, prices at intraday 3/30/2026