Gen X Woes; Consumer Velocity Stable; Borrowing Costs Stay Elevated; Wealth Effect Decelerates a Third Straight Week: Macro Monday (on Sunday)
Summary: (1) In our conversations with companies, we continue to hear about Gen Z and Boomer strength (and the pinch for Xers) … in Chart of the Week we highlight compelling analysis that after-tax, after-transfer incomes by age are just now falling below prior gens for the first time for Gen X (and Millennials appear at risk, too). The implications for retailers, restaurants, brands, and the economy are substantial. (2) Our math shows Consumer Velocity held stable last week, but below long-term averages, see Fig 1; (3) Mortgage applications stay down as borrowing costs stay elevated, see Fig 3-6; (4) Gas prices have significant retreat from highs, but remains +36% y/y T4W, see Fig 7; (5) Sentiment moved higher m/m after hitting all-time lows last month; we note lower-income and higher-income Sentiment had very different sequential moves, see Fig 9-12; and (6) the Wealth Effect Index decelerated for the third straight week, see Fig 13-16.
Chart of the Week: Incomes by Generation, by Age
We believe sectors, jobs, and asset ownership have clipped Gen X momentum unlike any prior generation in the modern US economy. The ratio of generational affinity is, more than ever, an important lead indicator we use to think about medium-long term outlooks.
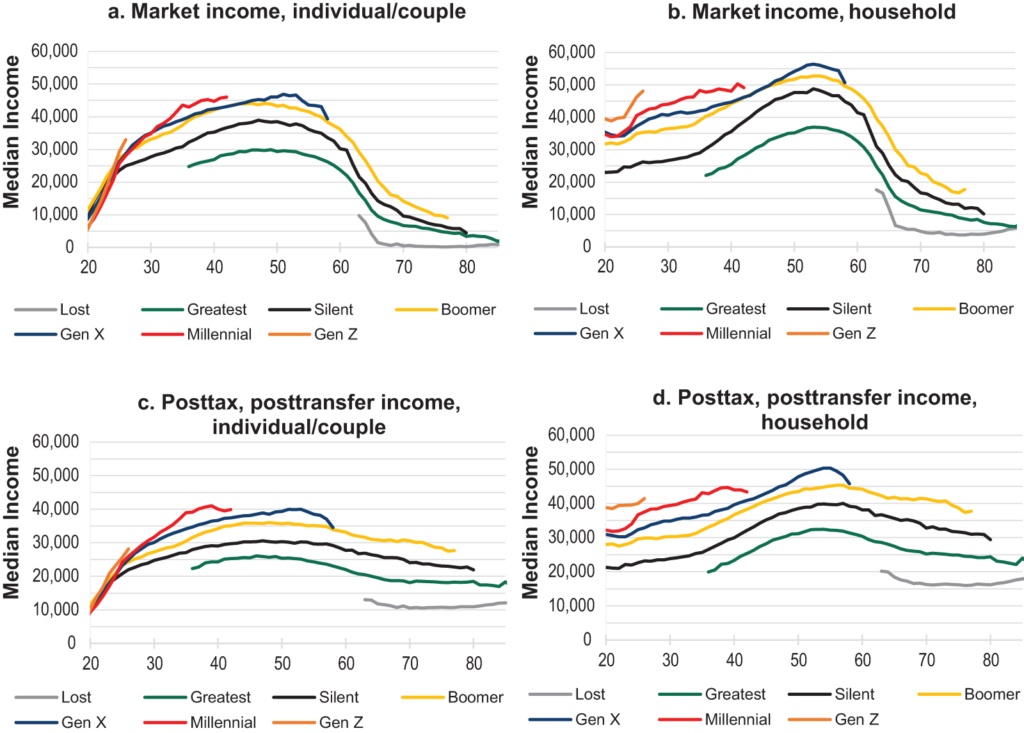
Source: Demography journal, Kevin Corinth, Jeff Latimore
Our Consumer Velocity tracker stayed consistent this week: the T4W held at +1.9% y/y vs. the same the prior week, while the T12W decelerated to +2.2% y/y (from +2.3%). The underlying trend remains slightly softer than average, 0.6 standard deviations below the post-2022 average on both a T4W and T12W basis. The T4W vs. T12W inflection was −0.3 pts, the third consecutive week (and 8th of the last 10 weeks) of shorter-term growth lagging longer-term, with the gap narrowing from −0.4 pts last week. See Fig 1-2.
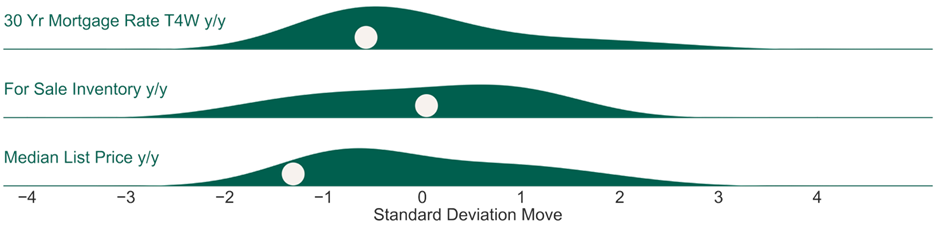
Housing borrowing costs remain elevated; leading housing indicators down. US 30Y FRM rate is up to 6.43%, running down -30 bps y/y on a T4W basis (0.2 standard deviations below average since 2020). MBA’s mortgage applications for purchase index is running down -7% y/y while refinance applications index is flat y/y. Median home prices are slightly down y/y. Roughly 18% of US GDP is related to the selling, building, fixing, lending to, and furnishing of homes – velocity matters for the economy. See Fig 3-6.
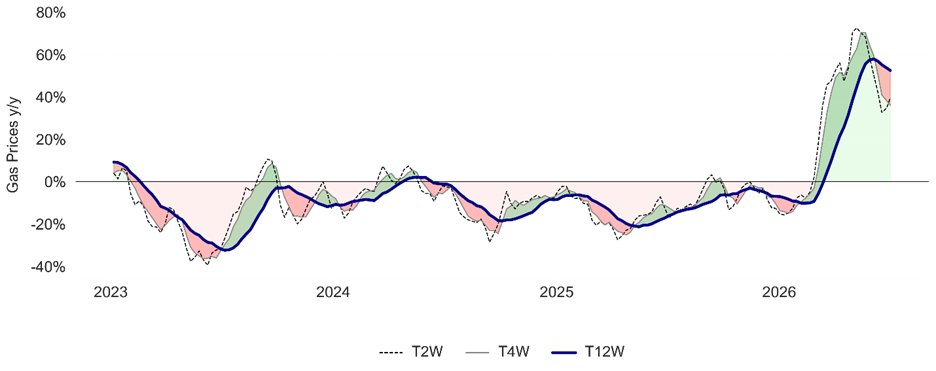
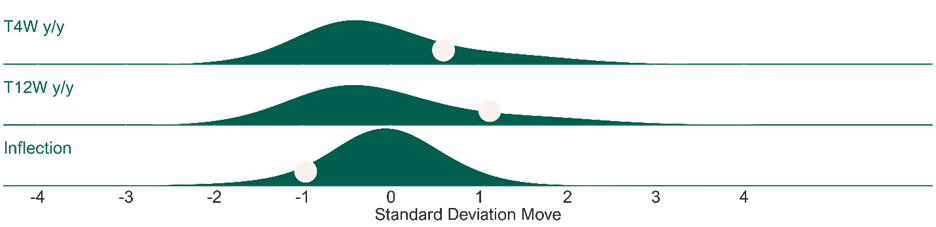
Gasoline inflation resumed decelerating this week, with the latest weekly print up +38% y/y (decelerating from +42%), the T4W at +36% y/y (from +38%), and the T12W at +52% y/y (from +54%). The T4W trend is 0.6 standard deviations above average, and the T4W vs. T12W inflection has deepened to −16.5 pts (from −15.5), with shorter-term growth now running well below the longer-term trend. We continue to flag that utilities (electricity and heating fuel) run about 9% of lower-income household spending vs. 4% for higher-income households, compounding the squeeze at the bottom of the income distribution. See Fig 7-8.
Sentiment increased off last month’s all-time low (44.8) to 49.5, but it remains the second-lowest reading on record, with headline Sentiment y/y decelerating to -18% this month (from -14%). Overall, headline Sentiment is down -18% y/y this month and -13% on a T3M basis (1.0 standard deviations below average) and -19% y/y on a T9M basis (1.8 standard deviations below average). Upper-third income Sentiment is down -6% y/y on a T3M basis (0.5 standard deviations below average), decelerating from -1% y/y T3M last month. Middle-income Sentiment is down -17% y/y on a T3M basis (1.3 standard deviations below average), decelerating from -11% y/y T3M last month, and lower-income Sentiment is -19% y/y on a T3M basis (1.6 standard deviations below average), decelerating from -15% last month, although lower-income Sentiment is up +26% m/m. See Fig 9-12.
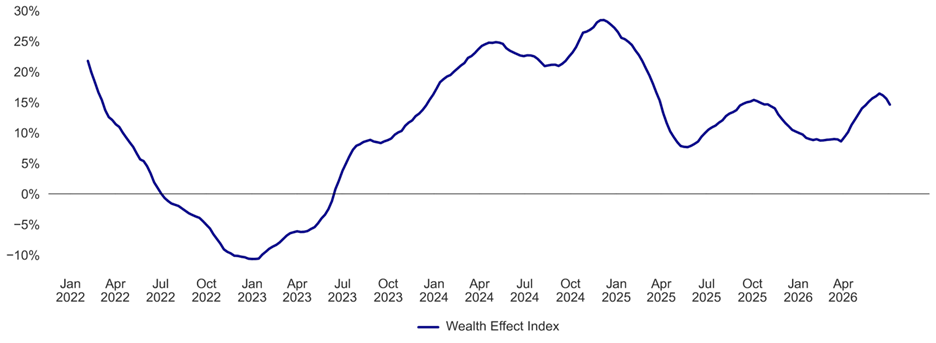
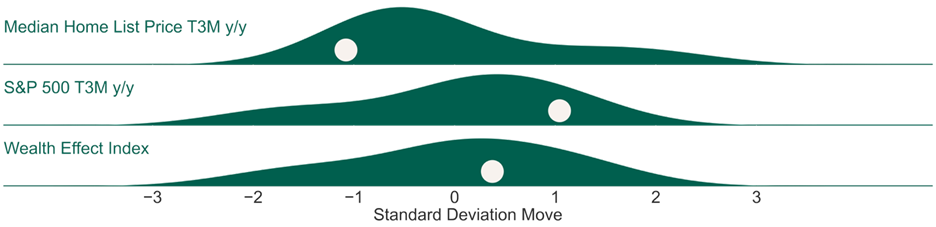
Consumer “Wealth Effect” decelerated again this week. Optimal Advisory’s Wealth Effect Index is at +14.6% y/y (decelerating from +15.6% y/y last week and 0.4 standard deviations above average since the start of 2022). With home prices slightly negative y/y and despite headwinds from lower crypto prices we note the “flywheel” of wealth effect remains elevated off strong equity returns. See Fig 13-16.
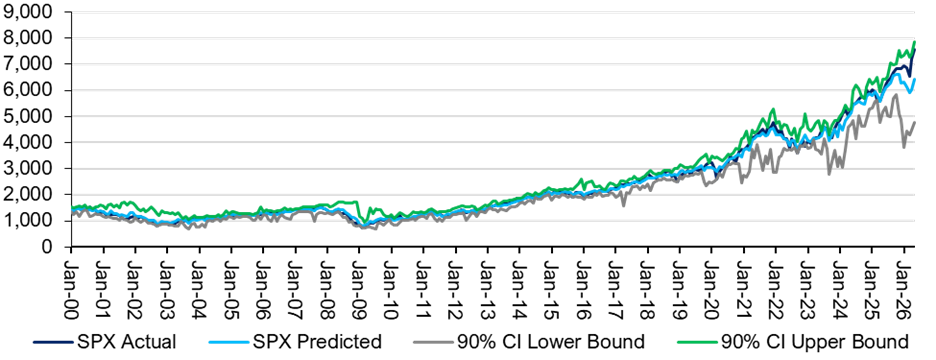
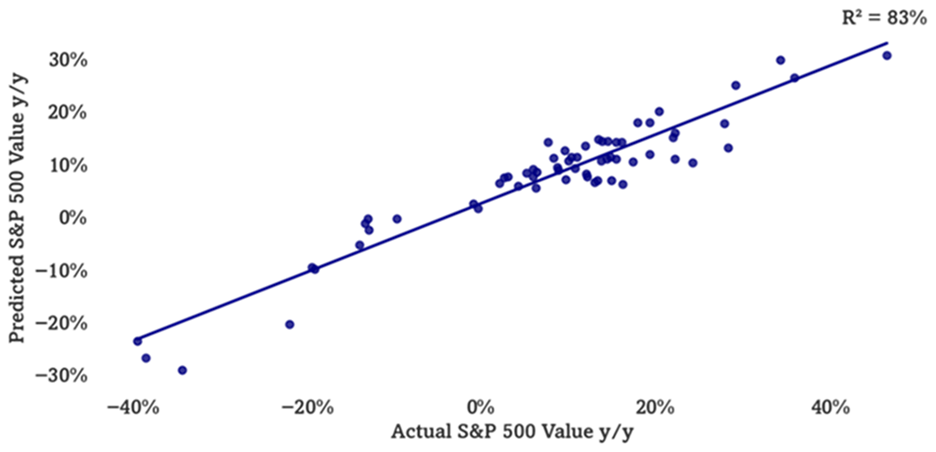
Our Multifactor Macro Market Model had been suggestive of March 2026 softness, rebound. Optimal’s Multifactor Macro Market Model projects the S&P 500 as well as bull and bear cases based on lagged data for 12 macroeconomic factors. The model suggested the S&P 500 to fall to just below 6000 by March, before rebounding back up to 6400 by May. We use this model as a guide to how macro would guide the market, given our analysis of current variables. This is, of course, outside of other factors at work. See Fig 17-18.
Figures 1-2: Optimal Advisory Consumer Velocity Monitor
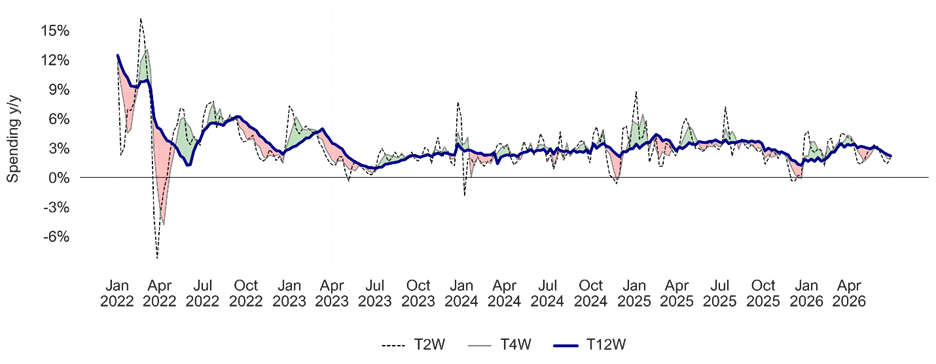
Source: Optimal Advisory Analysis, Bloomberg Second Measure
Consumer Spending y/y Relative to Historical Average
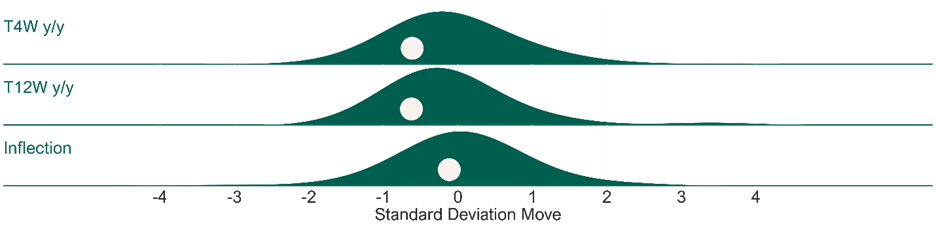
Source: Optimal Advisory Analysis, Bloomberg Second Measure
Figures 3-6: Housing Kinetic Energy
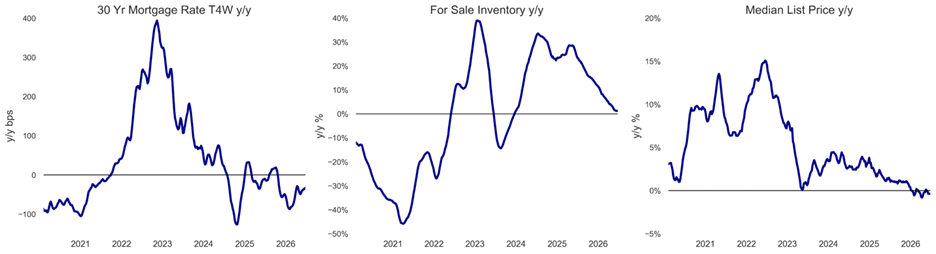
Source: Optimal Advisory Analysis, Freddie Mac, Zillow, Redfin
Mortgage Rates, For Sale Inventory, & Median List Price y/y Relative to Historical Averages (Since 2020)
Source: Optimal Advisory Analysis, Freddie Mac, Zillow, Redfin
Figures 7-8: Gas Prices y/y
Source: Optimal Advisory Analysis, Bloomberg
Gas Prices y/y Relative to Historical Averages (Since 1992)
Source: Optimal Advisory Analysis, Bloomberg
Figures 9-12: Consumer Sentiment T3M and T9M y/y
Sentiment y/y by Income Tercile
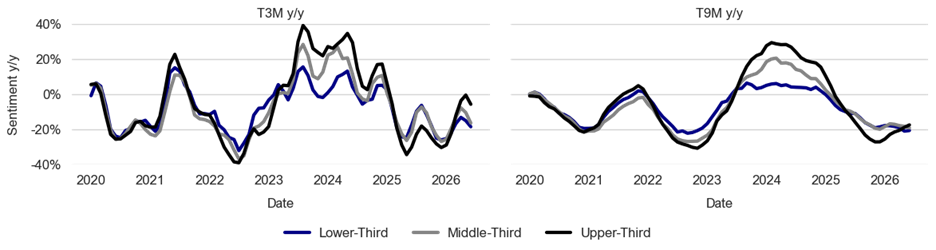
Comparison of Sentiment y/y Across Income Terciles
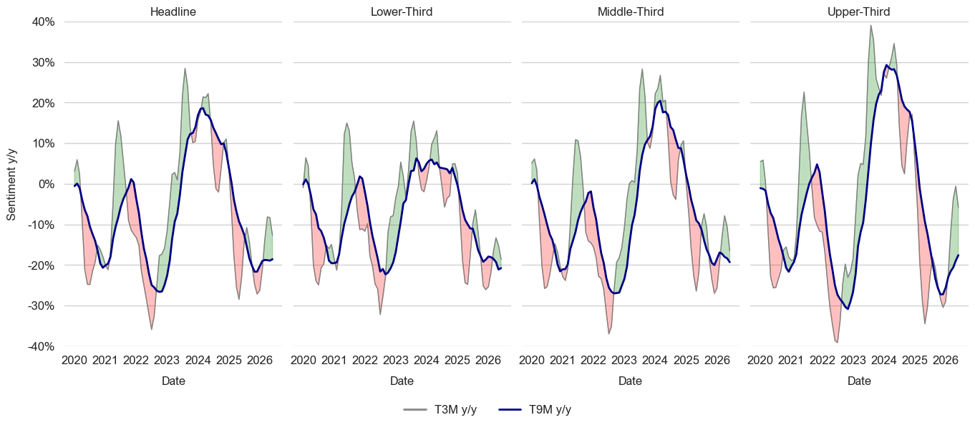
Source: Optimal Advisory Analysis, University of Michigan Consumer Survey
Figures 13-16: Consumer Wealth Effect & Components y/y
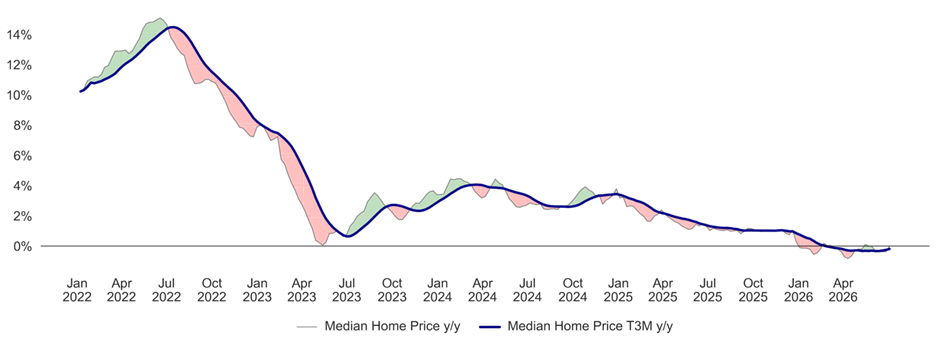
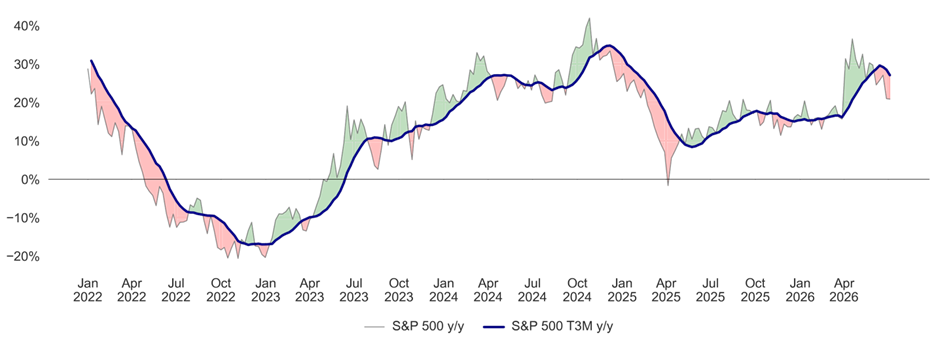
Source: Optimal Advisory Analysis, Bloomberg, Zillow, Redfin
Median Home Price y/y, S&P 500 y/y, & Wealth Effect Index (Since 2022)
Source: Optimal Advisory Analysis, Bloomberg, Zillow, Redfin
Figures 17-18: Optimal Advisory Multifactor Macro Market Model
Historical Test Predictions vs. Actual (On Test Data Only)
Source: Optimal Advisory Proprietary Analysis, Bloomberg, FRED, BLS, BEA, OECD, University of Michigan Consumer Sentiment Survey, U.S. Census Bureau, FRB
Actual & Projected S&P 500 (Including Training & Test Data) with Confidence Intervals
Source: Optimal Advisory Proprietary Analysis, Bloomberg, FRED, BLS, BEA, OECD, University of Michigan Consumer Sentiment Survey, U.S. Census Bureau, FRB
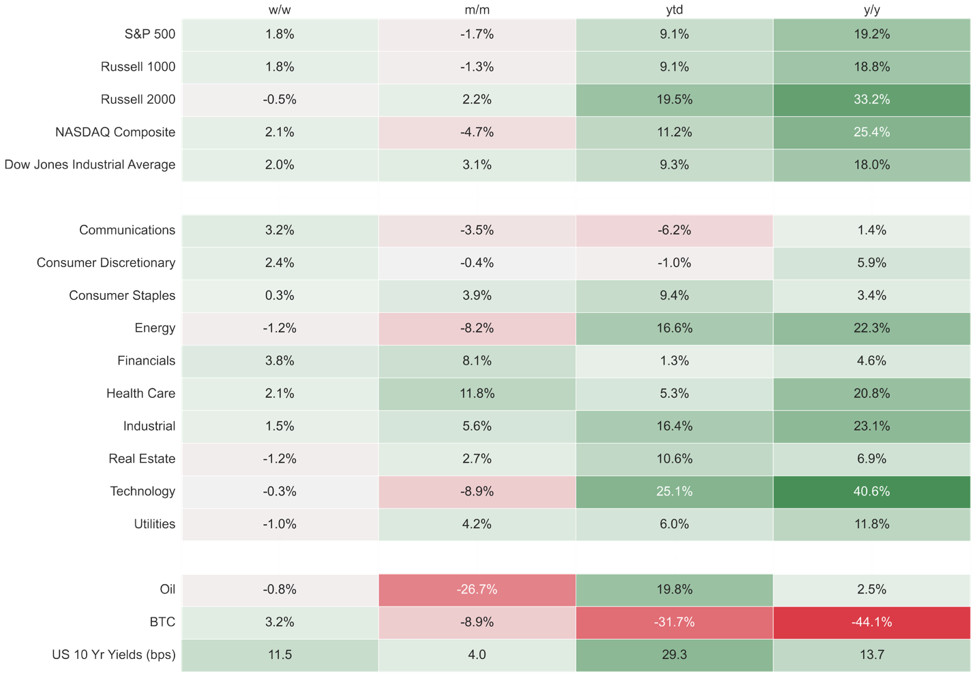
Figure 19: Index & Sector Performance
Source: Optimal Advisory Analysis, Bloomberg, prices at market close 7/2/2026