Gen Z Winners & Losers: June Analysis across Sectors (Callouts Include TPR, SHAK, GPI, BYD)
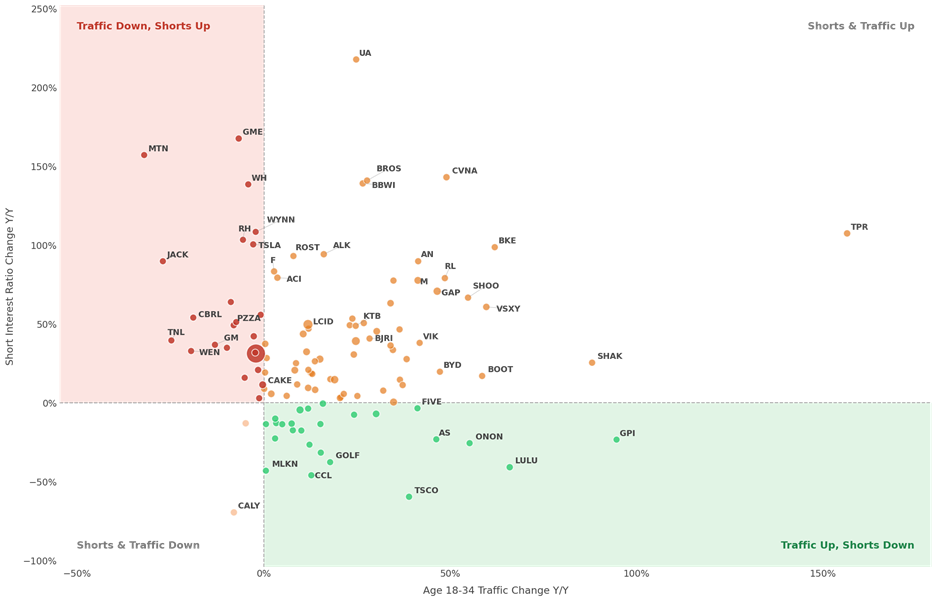
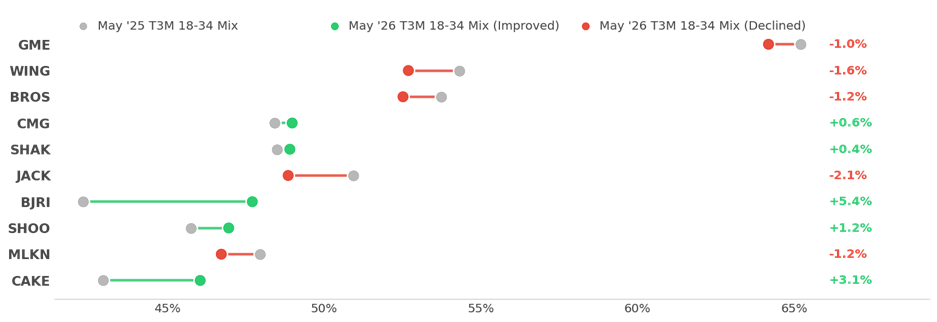
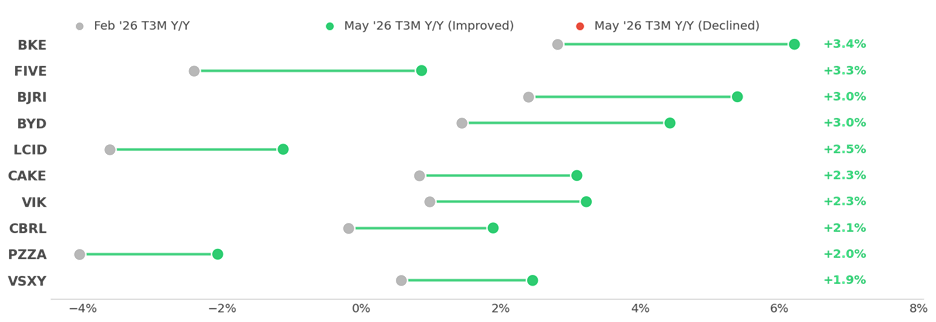
Summary: Gen Z traction and growth are critical leading indicators given long-term demographic share shifts – in our June analysis of 114 names: (1) please see notable metrics from TPR, GPI, SHAK in Gen Z traction growth (Figure 1); (2) BKE, FIVE, BJRI show the strongest positive inflection; (3) GME, WING, BROS have high mix and negative inflection, while a new set of Gen Z restaurants in positive inflection are emerging; (4) we note 2 of the largest increase in short interest paired with declining Gen Z traction are lodging and leisure names; (5) our updated five lead sector inflection in Travel, Restaurants, Autos, Apparel, and Retail respectively.
Top traction gainers: TPR, GPI, SHAK lead all 114 names in Gen Z traction growth (Figure 1), with TPR posting +156% Y/Y in 18-34 traffic and an equivalent rise in short interest; GPI is a notable green-quadrant outlier (+95% traffic, -23% short interest).
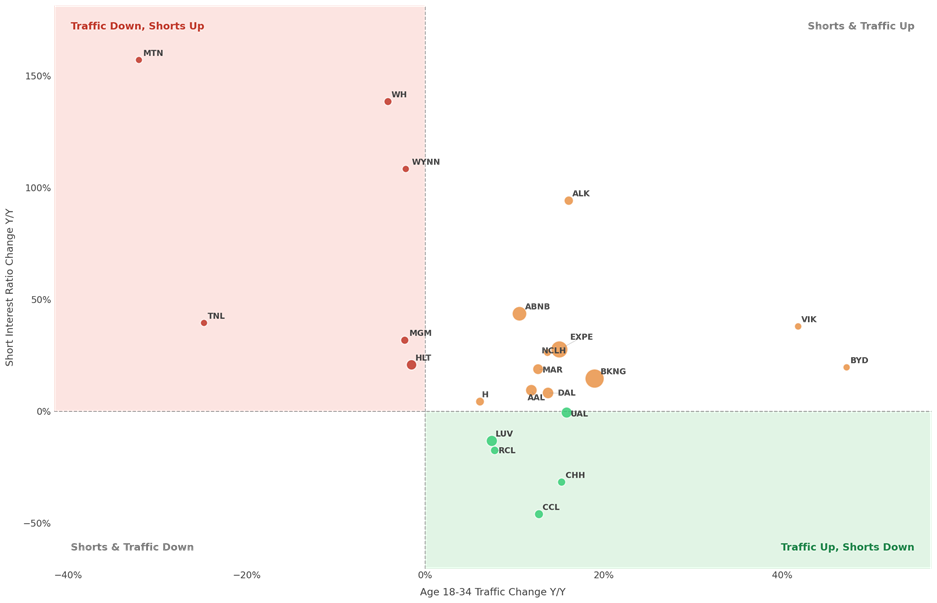
Short interest callouts: GME, MTN, WH show the largest rises in short interest paired with declining Gen Z traction (see Figure 1).
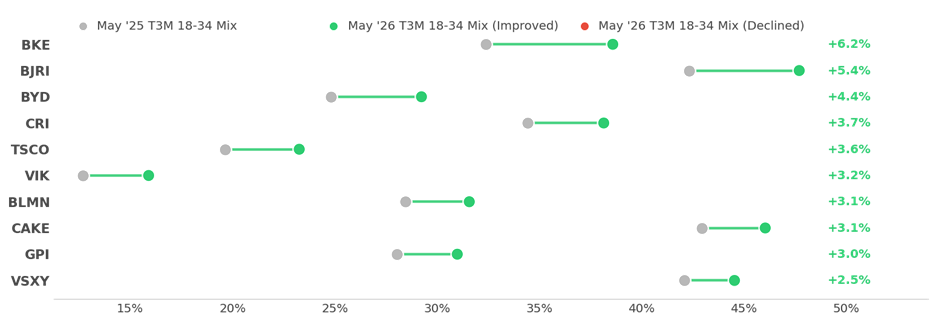
Highest 18–34 mix: GME, WING, BROS (all three currently inflecting negatively), while BJRI, SHAK, CMG are inflecting positively (Figure 2). Strongest Gen Z traffic Y/Y growth: BKE, BJRI, BYD (Figure 3).
Strongest positive inflections (Mar–May 2026 y/y vs. prior 3m trend): BKE, FIVE, BJRI (Figure 4).
Sector leaders
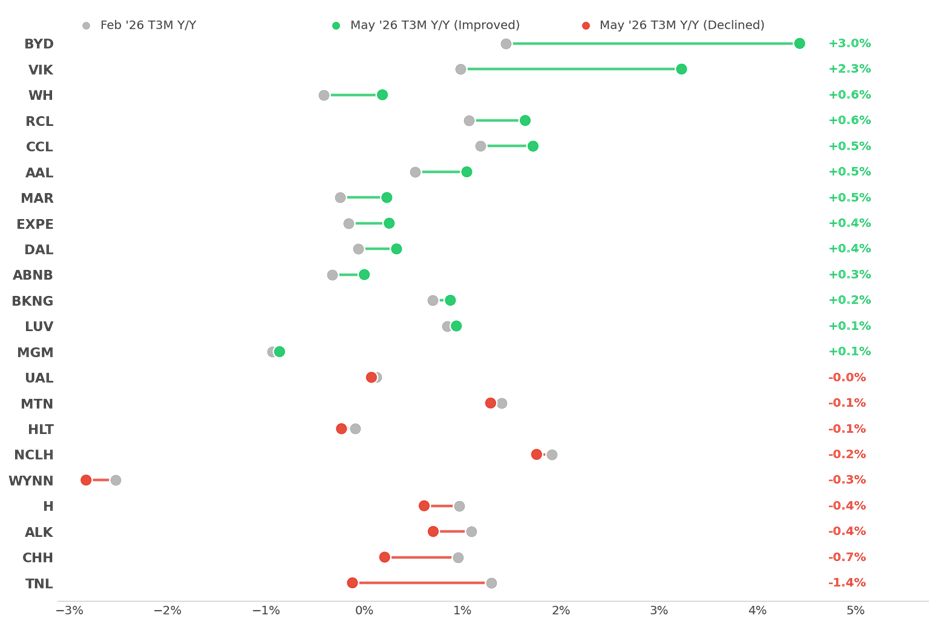
Travel / leisure: BYD, VIK, WH leading on inflection; BYD, VIK, BKNG leading on Y/Y growth.
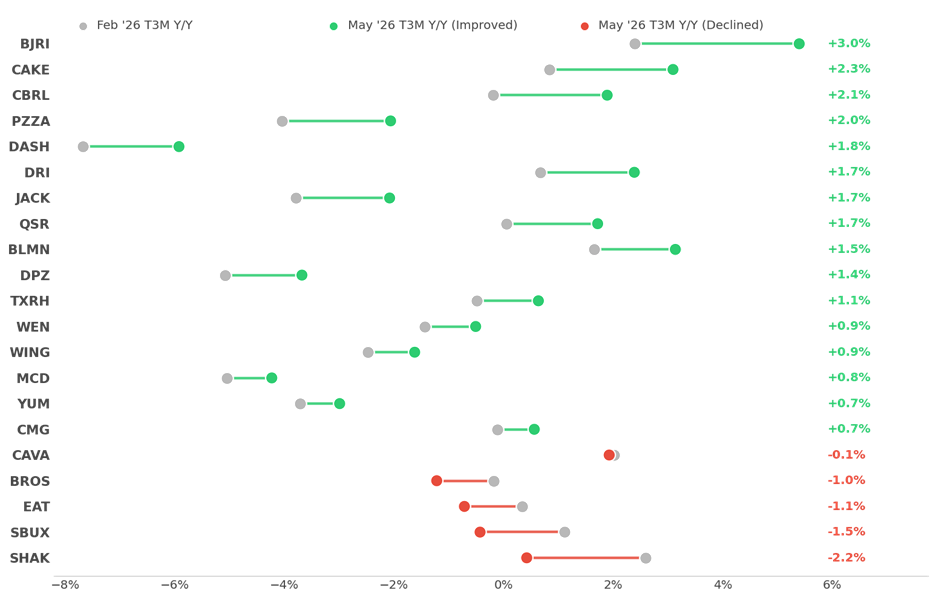
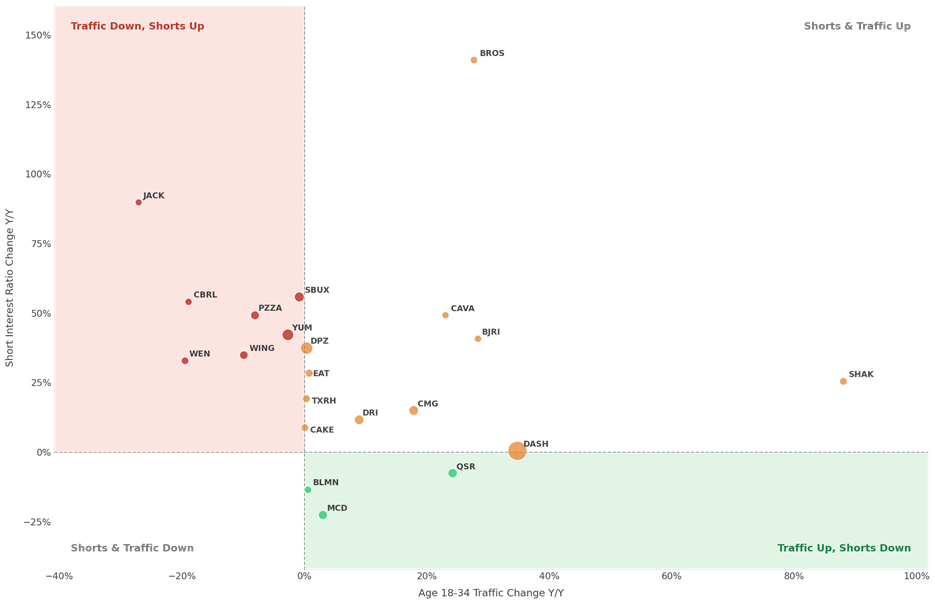
Restaurants: BJRI, CAKE, CBRL leading on inflection; SHAK, DASH, BJRI leading on Y/Y growth.
Automotive: LCID, KMX, AZO leading on inflection; GPI, CVNA, AN leading on Y/Y growth.
Apparel & golf: BKE, VSXY, PVH leading on inflection; TPR, LULU, BKE leading on Y/Y growth.
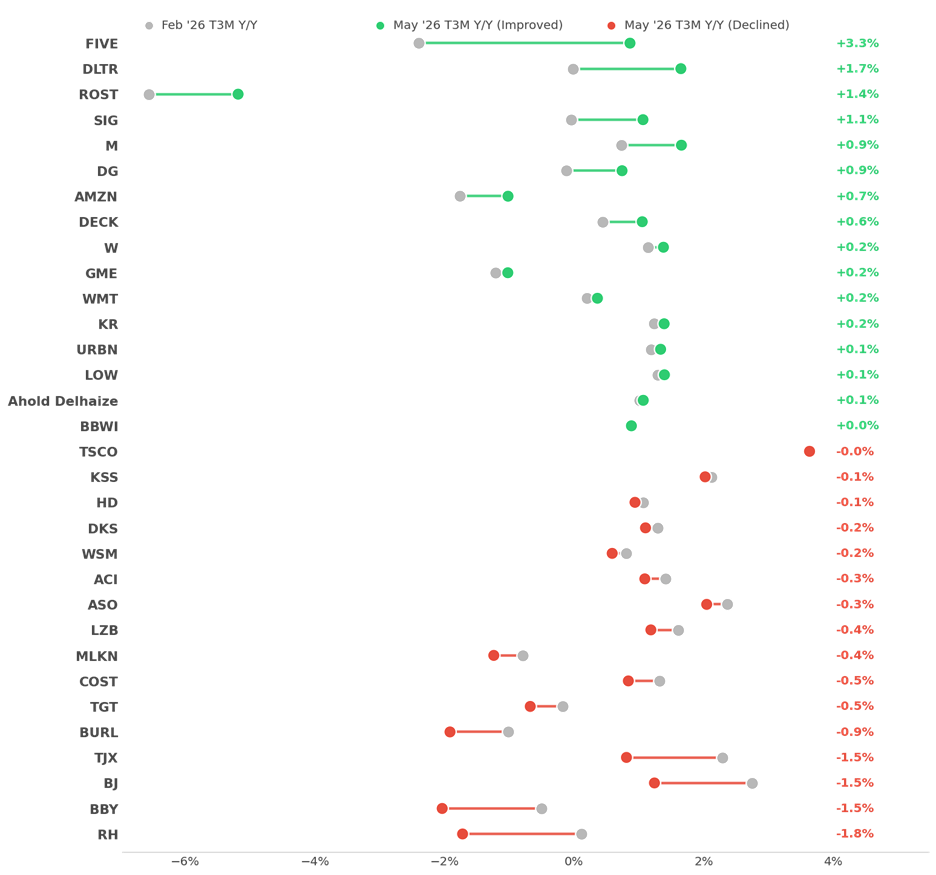
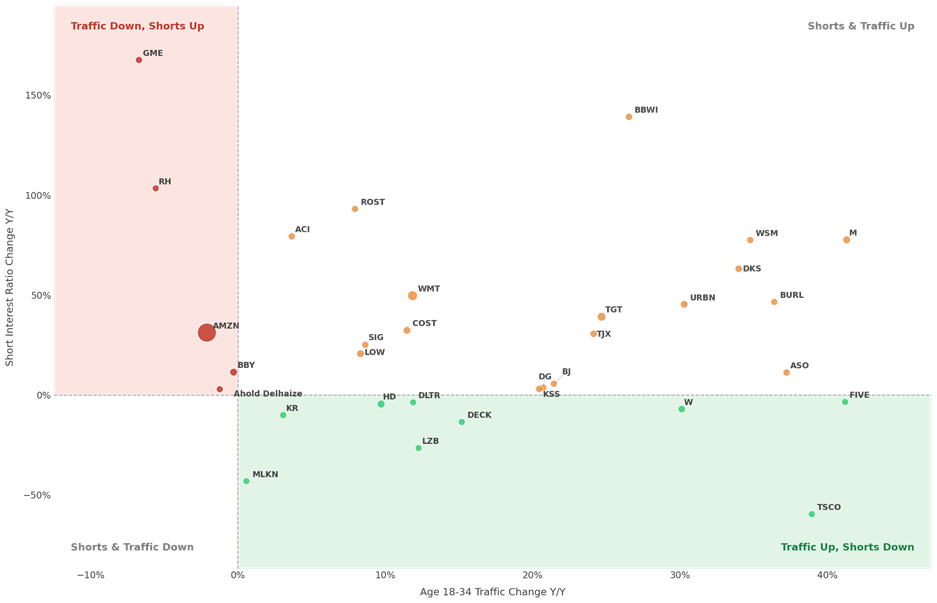
Retail: FIVE, DLTR, ROST leading on inflection; M, FIVE, TSCO leading on Y/Y growth.
All Companies
Figure 1: Change in Short Interest Ratio vs. Change in 18-34 Digital Traffic (Y/Y)
Source: Optimal Advisory analysis, Similarweb, Bloomberg
Figure 2: Top 10 Gen Z Traffic Mix May ’26 vs. May ’25
Source: Optimal Advisory analysis, Similarweb
Figure 3: Top 10 Gen Z Traffic Y/Y Gainers
Source: Optimal Advisory analysis, Similarweb
Figure 4: Top 10 Gen Z Traffic Inflections (Feb ’26 Y/Y → May ’26 Y/Y)
Source: Optimal Advisory analysis, Similarweb
Leisure, Accommodations, & Travel
Figure 5: Leisure, Accommodations, & Travel Gen Z Traffic Inflections
Source: Optimal Advisory analysis, Similarweb
Figure 6: Leisure, Accommodations, & Travel Change in Short Interest vs. Change in 18-34 Digital Traffic (Y/Y)
Source: Optimal Advisory analysis, Similarweb, Bloomberg
Restaurants
Figure 7: Restaurants Gen Z Traffic Inflections
Source: Optimal Advisory analysis, Similarweb
Figure 8: Restaurants Change in Short Interest vs. Change in 18-34 Digital Traffic (Y/Y)
Source: Optimal Advisory analysis, Similarweb, Bloomberg
Automotive
Figure 9: Automotive Gen Z Traffic Inflections
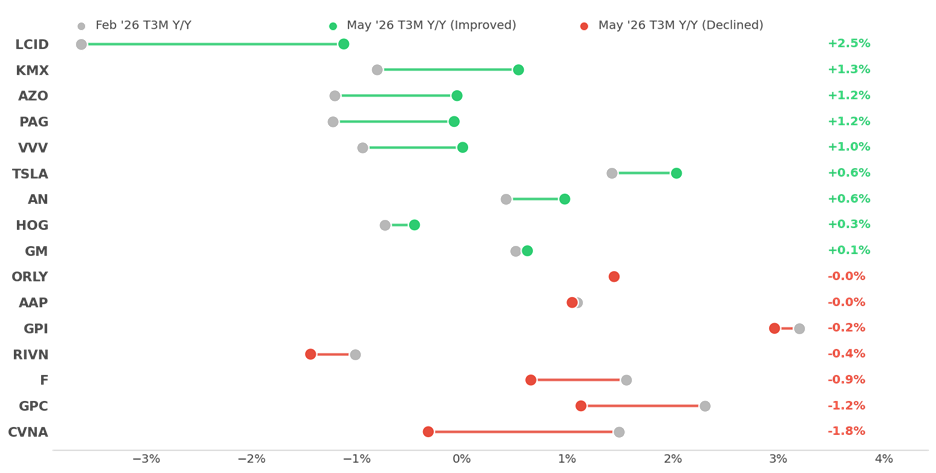
Source: Optimal Advisory analysis, Similarweb
Figure 10: Automotive Change in Short Interest vs. Change in 18-34 Digital Traffic (Y/Y)
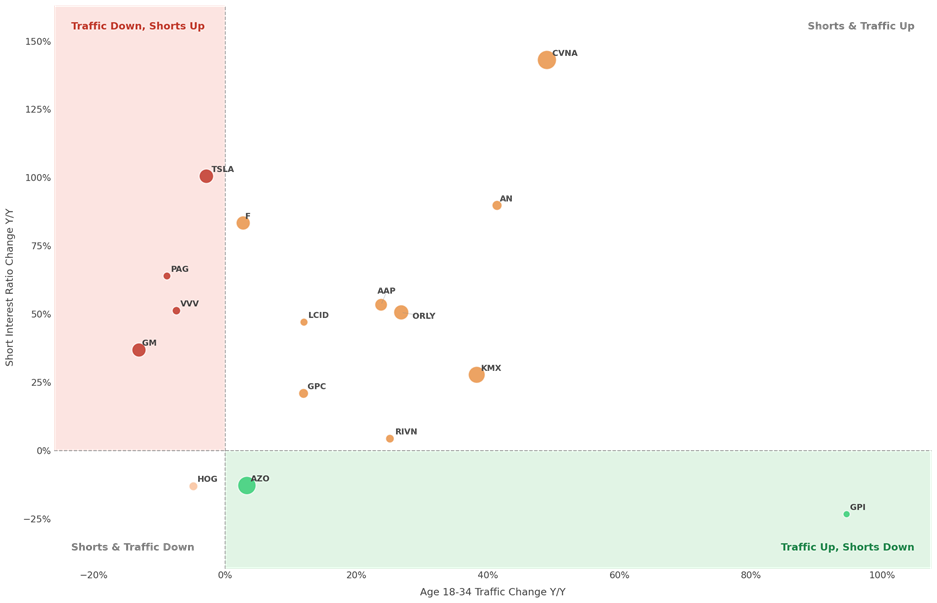
Source: Optimal Advisory analysis, Similarweb, Bloomberg
Apparel & Golf
Figure 11: Apparel & Golf Gen Z Traffic Inflections
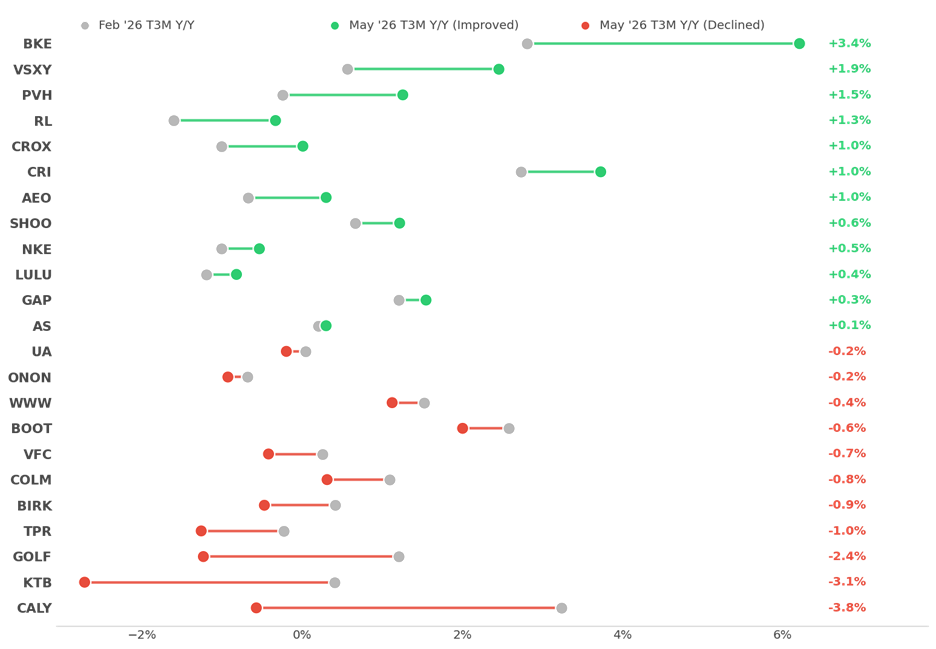
Source: Optimal Advisory analysis, Similarweb
Figure 12: Apparel & Golf Change in Short Interest vs. Change in 18-34 Digital Traffic (Y/Y)
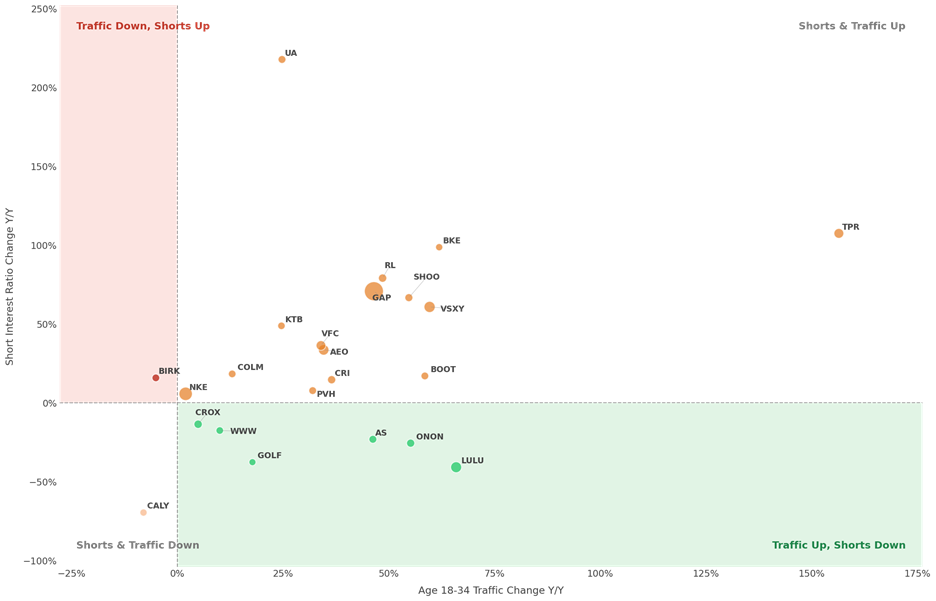
Source: Optimal Advisory analysis, Similarweb, Bloomberg
Retail
Figure 13: Retail Gen Z Traffic Inflections
Source: Optimal Advisory analysis, Similarweb
Figure 14: Retail Change in Short Interest vs. Change in 18-34 Digital Traffic (Y/Y)
Source: Optimal Advisory analysis, Similarweb, Bloomberg