Income’s 9 or 13 Year Event; Wealth Effect Ends 11 Week Streak; Consumer Velo Soft and with Decel: Macro Monday (on Sunday)
Summary: (1) RDI has spent the last three months at a pace rarely seen, we examine that and precedents in Chart of the Week; (2) Our math shows Consumer Velocity decelerated further last week, see Fig 1; (3) Housing inventory continues to approach flat y/y after spending the last two years up meaningfully y/y, see Fig 3-6; (4) Gas prices have significantly retreated from highs, but sticky gas inflation remains the dominant macro signal at +38% y/y T4W, see Fig 7; (5) Sentiment moved higher m/m after hitting all-time lows last month but very different inflections by income strata, see Fig 9-12; and (6) Wealth Effect Index had a subtle but notable shift, breaking an 11 week streak, see Fig 13-16.
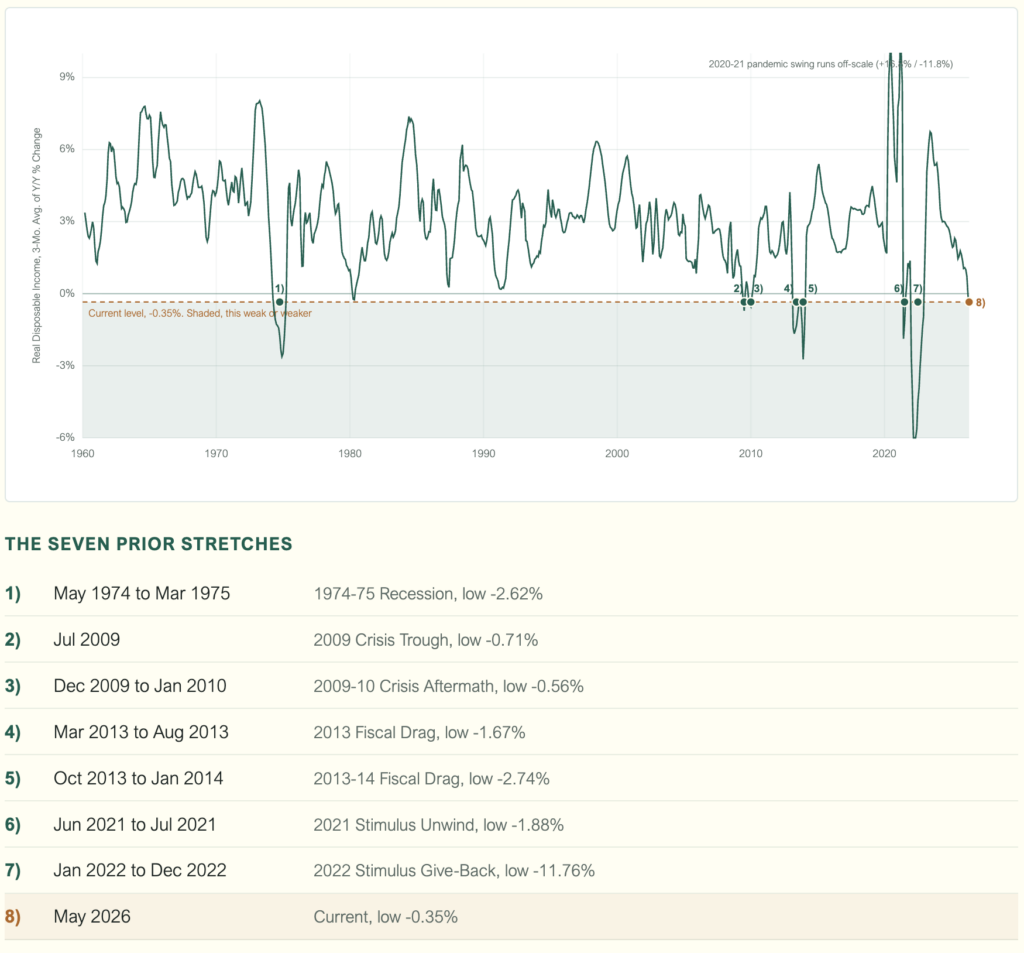
Chart of the Week: RDI in Rare Negative Territory, t3m y/y
RDI has only run this soft y/y 7 times since 1960 (or 5 times if Covid whipsaws and comparisons are removed). Current softness is indeed notable.
Source: Optimal Advisory Analysis, FRED
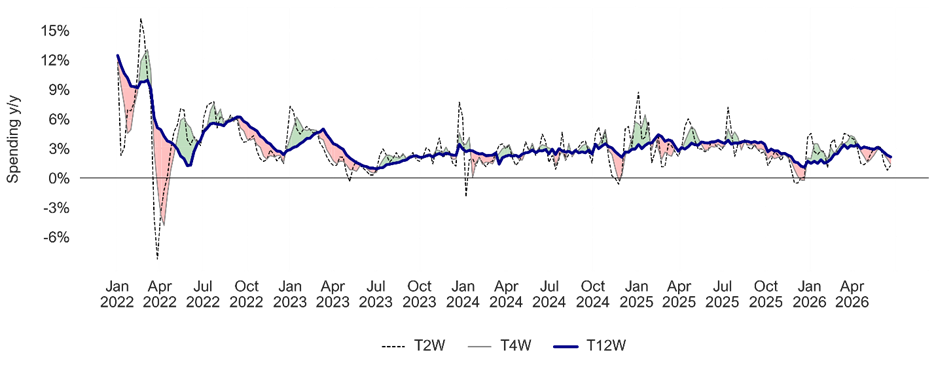
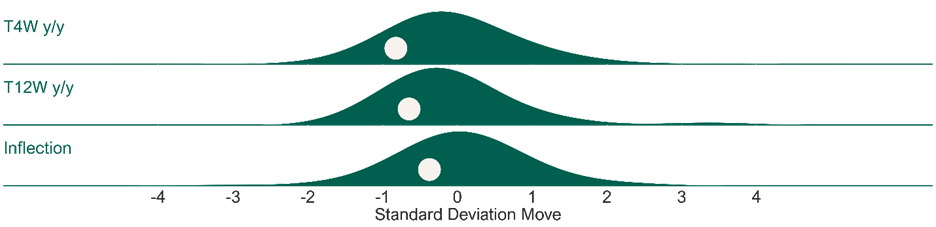
Our Consumer Velocity tracker decelerated further this week, with the T4W at +1.4% y/y vs. +1.9% the prior week, while the T12W trend also decelerated slightly to +2.1% y/y (from +2.3%). The underlying trend remains soft (0.8 standard deviations below the post-2022 average on a T4W basis and 0.6 on a T12W basis). The T4W vs. T12W inflection was −0.8 pts, the third consecutive week (and 9th in the last 10 weeks) of shorter-term growth lagging longer-term, with the gap widening from −0.4 pts last week. See Fig 1-2.
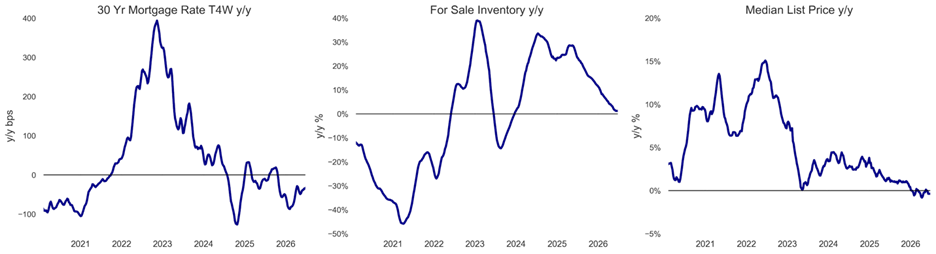
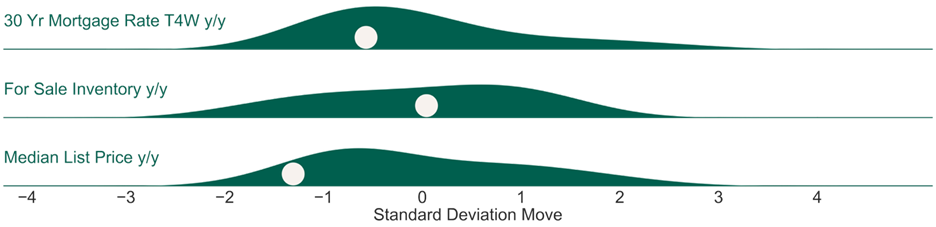
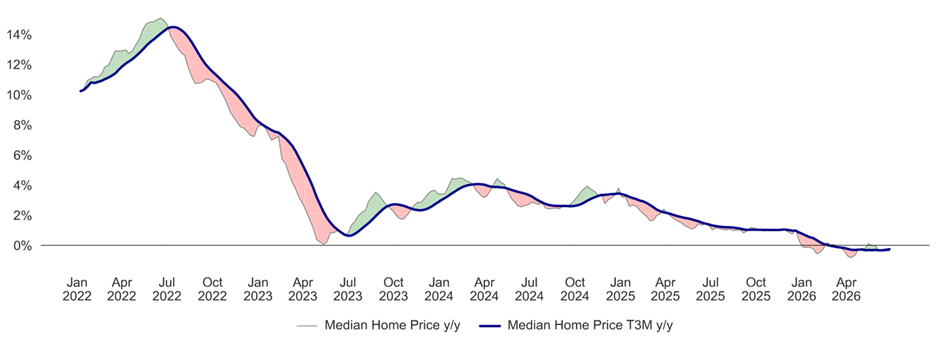
Housing borrowing costs remain elevated, prices flat as supply continues to decelerate. US 30Y FRM rate is up to 6.49%, running down -33 bps y/y on a T4W basis (0.5 standard deviations below average since 2020). US for-sale inventory up only 1.3% and has linearly decelerated from +28% from the same time last year. MBA’s mortgage applications for purchase index is running up +3% y/y while refinance applications index is running up +14% y/y. Median home prices are flat y/y. Roughly 18% of US GDP is related to the selling, building, fixing, lending to, and furnishing of homes – velocity matters for the economy. See Fig 3-6.
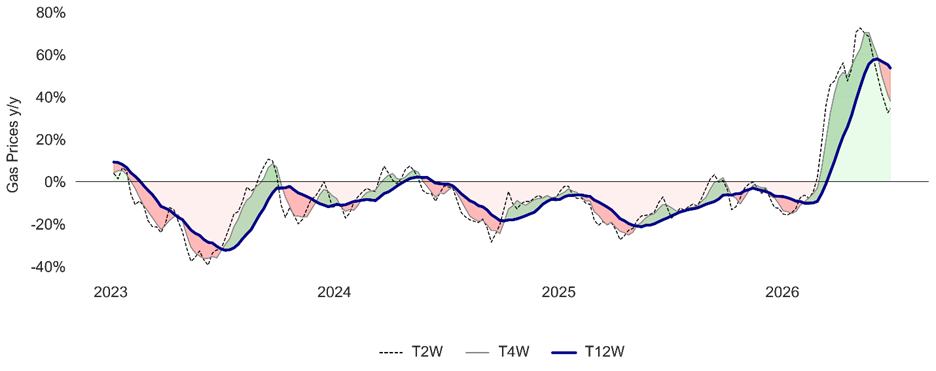
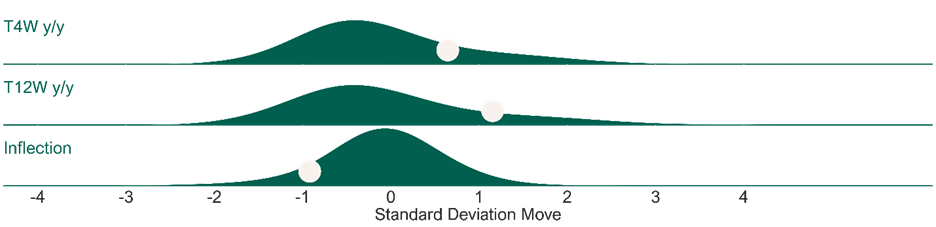
Gasoline inflation was mixed this week: the latest weekly print re-accelerated to +42% y/y (from +29%), while the smoothed trends continued to decelerate, with the T4W now at +38% y/y and the T12W at +54% y/y. The T4W trend is 0.6 standard deviations above average, and the T4W vs. T12W inflection has deepened to −15.5 pts (from −14.3), with shorter-term growth now running well below the longer-term trend. We continue to flag that utilities (electricity and heating fuel) run about 9% of lower-income household spending vs. 4% for higher-income households, compounding the squeeze at the bottom of the income distribution. See Fig 7-8.
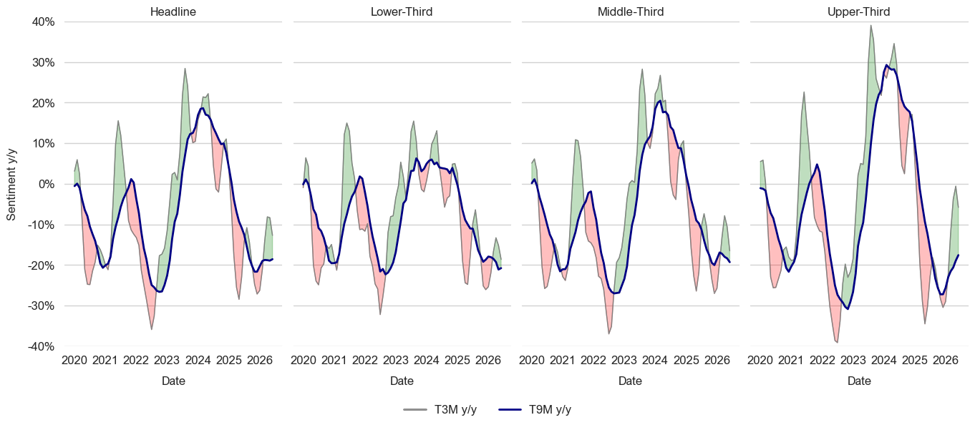
Sentiment increased off last month’s all-time low (44.8) to 49.5, but it remains the second-lowest reading on record, with headline Sentiment y/y decelerating to -18% this month (from -14%). Overall, headline Sentiment is down -18% y/y this month and -13% on a T3M basis (1.0 standard deviations below average) and -19% y/y on a T9M basis (1.8 standard deviations below average). Upper-third income Sentiment is down -6% y/y on a T3M basis (0.5 standard deviations below average), decelerating from -1% y/y T3M last month. Middle-income Sentiment is down -17% y/y on a T3M basis (1.3 standard deviations below average), decelerating from -11% y/y T3M last month, and lower-income Sentiment is -19% y/y on a T3M basis (1.6 standard deviations below average), decelerating from -15% last month, although lower-income Sentiment is up +26% m/m. See Fig 9-12.
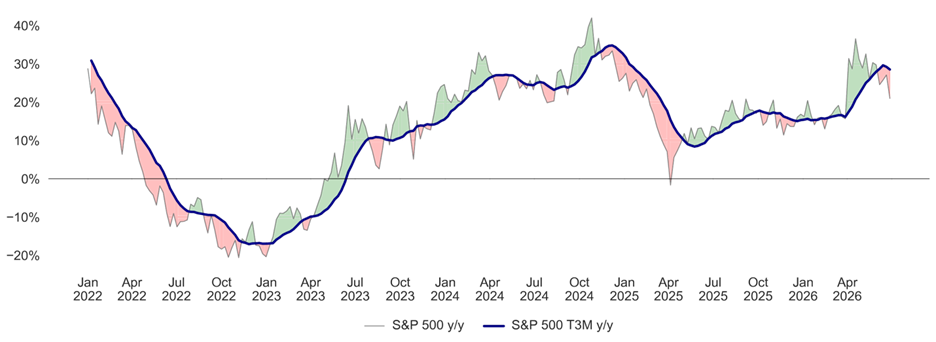
Consumer “Wealth Effect” decelerated again this week. Optimal Advisory’s Wealth Effect Index is at +15.7% y/y (decelerating from +16.1% y/y last week and 0.5 standard deviations above average since the start of 2022 after running higher w/w for 12 consecutive weeks). With home prices negative y/y and despite headwinds from lower crypto prices we note the “flywheel” of wealth effect remains elevated off strong equity returns. See Fig 13-16.
Our Multifactor Macro Market Model has been suggestive of March 2026 softness, rebound. Optimal’s Multifactor Macro Market Model projects the S&P 500 as well as bull and bear cases based on lagged data for 12 macroeconomic factors. The model suggested the S&P 500 to fall to just below 6000 by March, before rebounding back up to 6400 by May. We use this model as a guide to how macro would guide the market, given our analysis of current variables. This is, of course, outside of other factors at work. See Fig 17-18.
Figures 1-2: Optimal Advisory Consumer Velocity Monitor
Source: Optimal Advisory Analysis, Bloomberg Second Measure
Consumer Spending y/y Relative to Historical Average
Source: Optimal Advisory Analysis, Bloomberg Second Measure
Figures 3-6: Housing Kinetic Energy
Source: Optimal Advisory Analysis, Freddie Mac, Zillow, Redfin
Mortgage Rates, For Sale Inventory, & Median List Price y/y Relative to Historical Averages (Since 2020)
Source: Optimal Advisory Analysis, Freddie Mac, Zillow, Redfin
Figures 7-8: Gas Prices y/y
Source: Optimal Advisory Analysis, Bloomberg
Gas Prices y/y Relative to Historical Averages (Since 1992)
Source: Optimal Advisory Analysis, Bloomberg
Figures 9-12: Consumer Sentiment T3M and T9M y/y
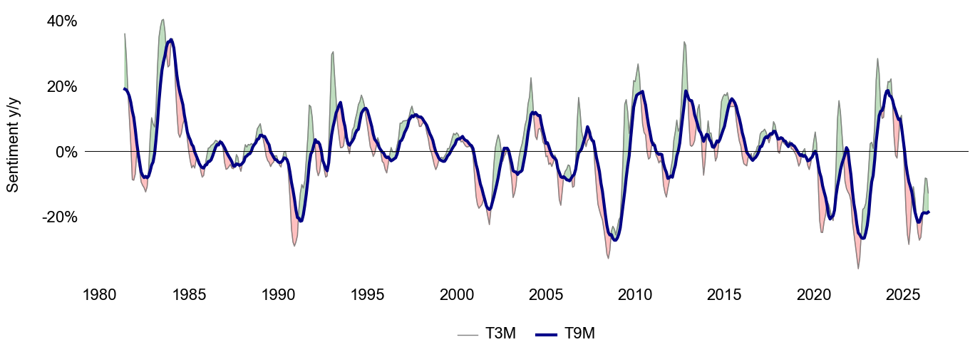
Sentiment y/y by Income Tercile
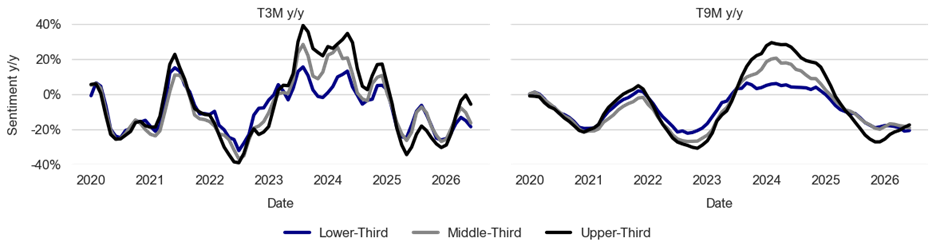
Comparison of Sentiment y/y Across Income Terciles
Source: Optimal Advisory Analysis, University of Michigan Consumer Survey
Figures 13-16: Consumer Wealth Effect & Components y/y
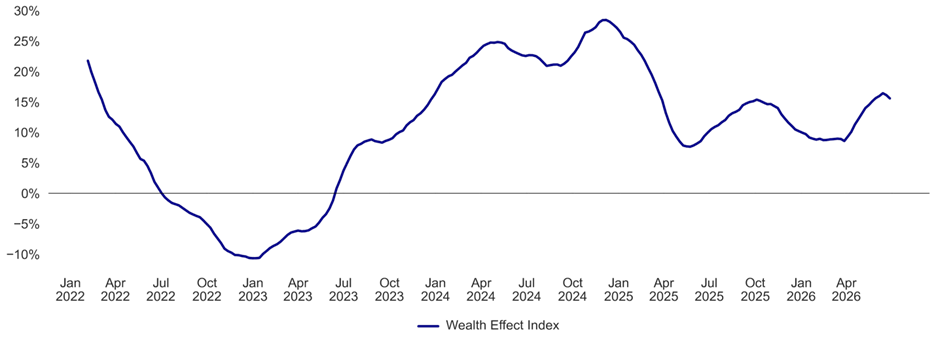
Source: Optimal Advisory Analysis, Bloomberg, Zillow, Redfin
Median Home Price y/y, S&P 500 y/y, & Wealth Effect Index (Since 2022)
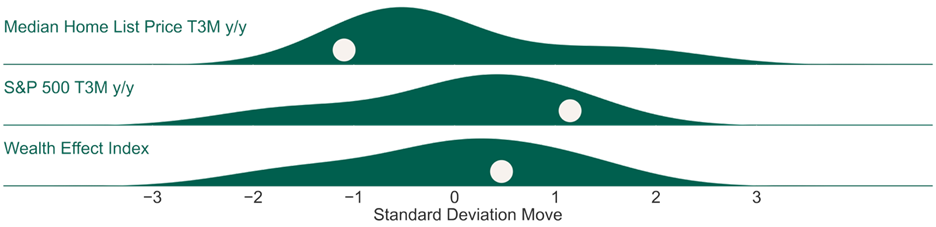
Source: Optimal Advisory Analysis, Bloomberg, Zillow, Redfin
Figures 17-18: Optimal Advisory Multifactor Macro Market Model
Historical Test Predictions vs. Actual (On Test Data Only)
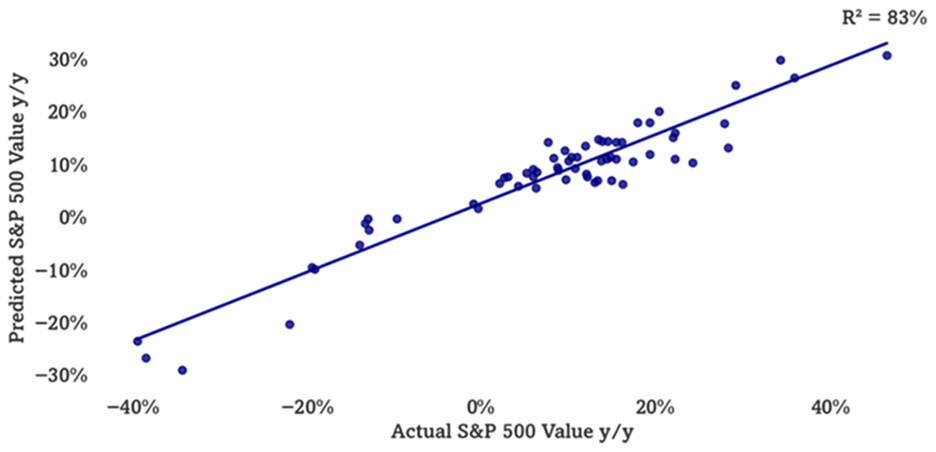
Source: Optimal Advisory Proprietary Analysis, Bloomberg, FRED, BLS, BEA, OECD, University of Michigan Consumer Sentiment Survey, U.S. Census Bureau, FRB
Actual & Projected S&P 500 (Including Training & Test Data) with Confidence Intervals
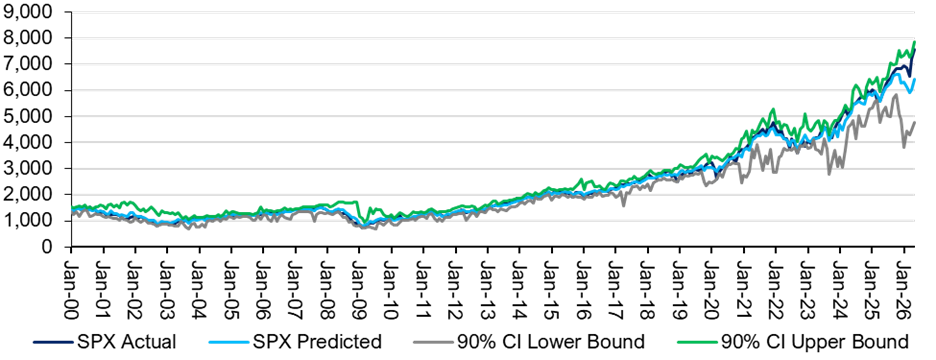
Source: Optimal Advisory Proprietary Analysis, Bloomberg, FRED, BLS, BEA, OECD, University of Michigan Consumer Sentiment Survey, U.S. Census Bureau, FRB
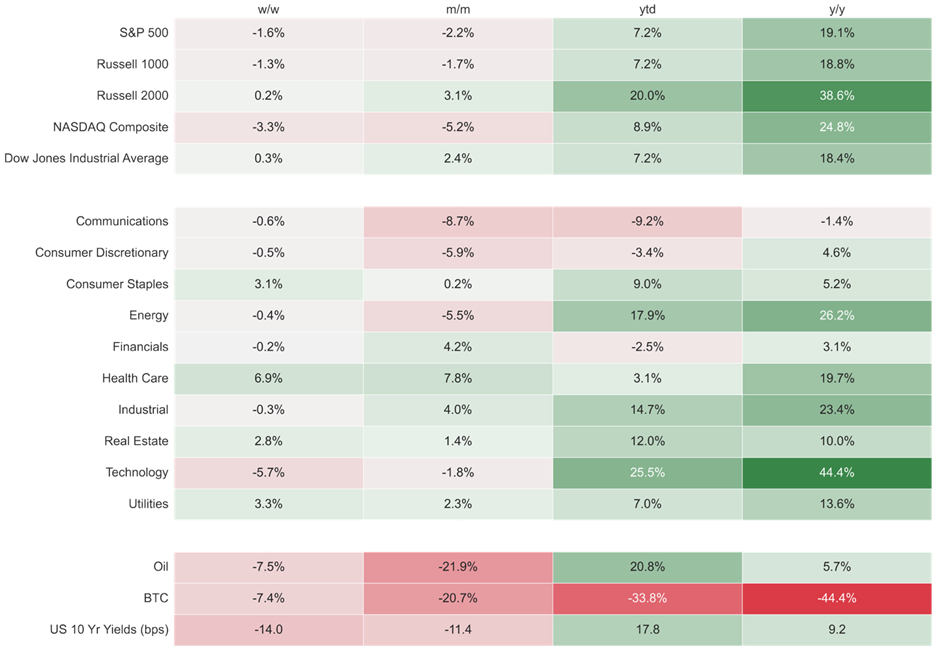
Figure 19: Index & Sector Performance
Source: Optimal Advisory Analysis, Bloomberg, prices at market close 6/26/2026