Input Costs +0.4% w/w, -12.6% y/y, Oilseeds Jump, Offset by Food & Energy Declines. Friday Cost Factor. HSY+, CMG+, HRL+, LW+, KR-, ACI-
Optimal Advisory Cost Factor – Cost Factor up (+0.4% w/w) and remains down sharply (-12.6%) y/y – a key tailwind for CPG, Foodservice & Restaurants; a key headwind for retailer comp.
Lower Input costs do a few things:
- Help restaurant (YUM, DRI, CMG, CAVA) margins and/or provide fuel for traffic driving spend promotions – especially timely given the rising importance of protein.
- Usually improve the economics of protein value chains generally (HRL, JBS, SFD, TSN) because end market pricing is stickier than upstream costs (e.g. feed).
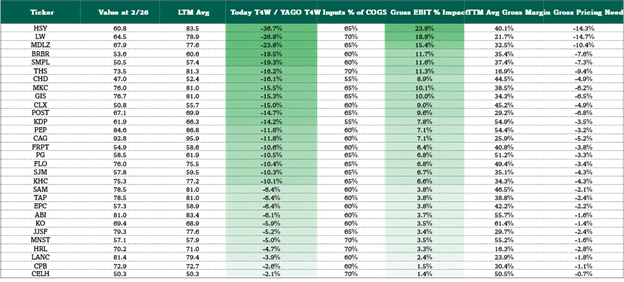
- Give a measurable H1 EPS tailwind to otherwise challenged CPG companies (HSY, MDLZ most) relative to planning period (early fall) expectations. See Fig 2.
- Challenge H1 2026 grocery comp both in perishables (KR, ACI) and stoking “select” price cuts (e.g. private label) as they chase traffic. It’s also partially what’s fueling “select” price cuts for center store CPG – which are getting less “select” by the day.
- Enhance center store grocery wallet through lower perishables spend (e.g. milk, meat, eggs), where input costs pass through directly.
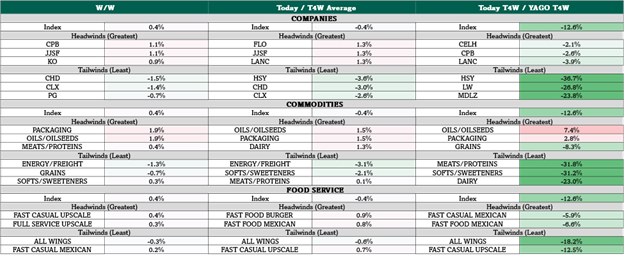
Cost tailwinds to watch: Meats/Proteins down -31.8% y/y, HSY -36.7% y/y, LW -26.8% y/y, Wing restaurants -18.2% y/y. See Fig 1.
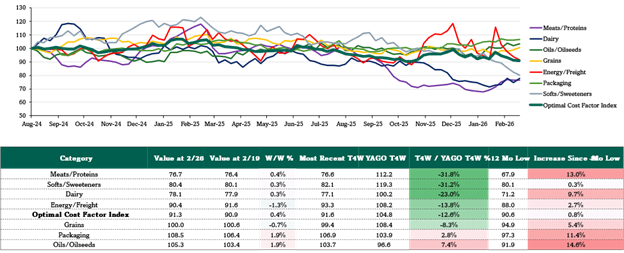
Cost headwinds to watch: Oil/oilseeds +7.4% y/y, Packaging +2.8% y/y
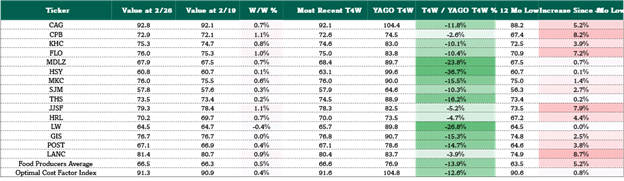
Food Inputs continue to lead input tailwinds. Paired with Energy declines means cost declines across supply chains. Meats/Proteins (-31.8% y/y), Softs/Sweeteners (-31.2% y/y), and Dairy (-23.0% y/y) continue to be the greatest beneficiary of lower input costs but are at higher levels than recent 12-month lows seen earlier in 2026. Food producers continue to lead average industry input cost y/y declines at -13.9% y/y, ahead of beverages (-7.2% y/y), HPC (-12.0% y/y), and food service (-10.1 % y/y). See Fig 5-8.
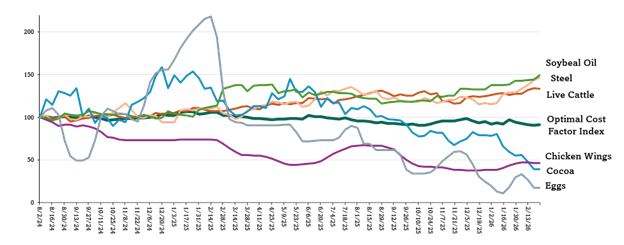
Oilseeds & Packaging Materials starting to add up. 19 of 32 measured commodities higher YTD to start 2026. Higher prices primarily in packaging materials and oils/oilseeds. Soybean oil has moved higher (+40.8% y/y) to lead measured commodities. Oils/Oilseed the leading commodity category in terms of headwinds, running up +7.4% y/y, and up +14.6% from 12-mo low.
Cost Factor +0.4% w/w, -12.6% y/y (vs. prior week -0.6% w/w & -12.0% y/y). Lower energy costs and food input costs continue to push cost factor lower across the staples economy. Some headwinds appearing in packaging materials and oilseeds. Cost factor higher this week after 4 consecutive weeks of decline. Input costs down double-digits y/y since mid-January.
In this weekly note, we identify spot input costs’ putative impact on the U.S. fast moving consumer goods (FMCG) value chain, most measurably impacting staples, staples retailers, restaurants & food service. Optimal’s proprietary cost factor weights ticker & sector specific cost trends using a proprietary formula based on 32 trackable spot cost inputs – 23 of which are updated as of last night, the other 9 are latest available.
Figure 1: Weekly Cost Factor Summary
Sources: Optimal Advisory Proprietary Analysis, Bloomberg, FRED, USDA, BEA
Figure 2: Weekly Cost Factor Margin Context
Sources: Optimal Advisory Proprietary Analysis, Bloomberg, FRED, USDA, BEA
Figure 3: Weekly Input Commodity Performance by Group
Sources: Optimal Advisory Proprietary Analysis, Bloomberg, FRED, USDA, BEA
Figure 4: Biggest Input Cost Movers y/y
Sources: Optimal Advisory Proprietary Analysis, Bloomberg, FRED, USDA, BEA
Figure 5: Food Sector Cost Factor
Sources: Optimal Advisory Proprietary Analysis, Bloomberg, FRED, USDA, BEA
Figure 6: Beverage Sector Cost Factor

Sources: Optimal Advisory Proprietary Analysis, Bloomberg, FRED, USDA, BEA
Figure 7: HPC Sector Cost Factor

Sources: Optimal Advisory Proprietary Analysis, Bloomberg, FRED, USDA, BEA
Figure 8: Restaurant Level Cost Factor

Sources: Optimal Advisory Proprietary Analysis, Bloomberg, FRED, USDA, BEA
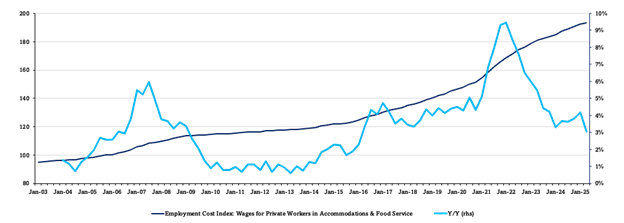
Figure 9: Restaurant Employment Cost Index
Sources: Optimal Advisory Proprietary Analysis, Bloomberg, FRED, USDA, BEA
Figure 10: Staples Sector Theme Box
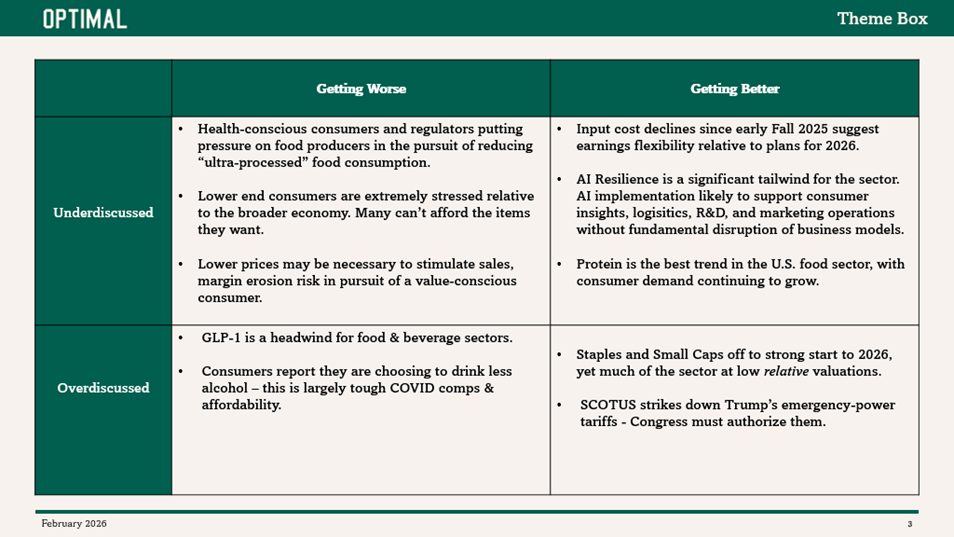
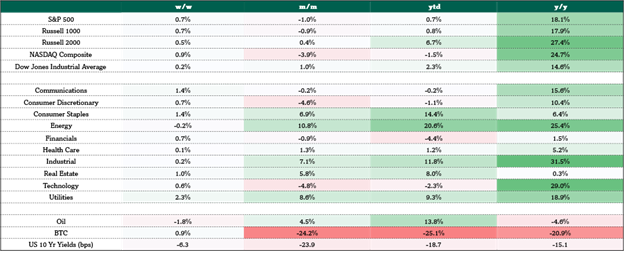
Figure 11: Market Sector Performance
Sources: Optimal Advisory Proprietary Analysis, Bloomberg