Input Costs -1.8% w/w, -10.8% y/y, Food Inputs Lead Decline. Energy Settles After Deep Freeze. Friday Cost Factor
Optimal Advisory Cost Factor – Cost Factor down w/w again this week and input costs continue to serve as tailwinds for Staples companies. The Optimal Cost Factor down (-1.8% w/w) and remains down sharply (-10.8%) y/y.
TLDR — lower Input costs do a few things:
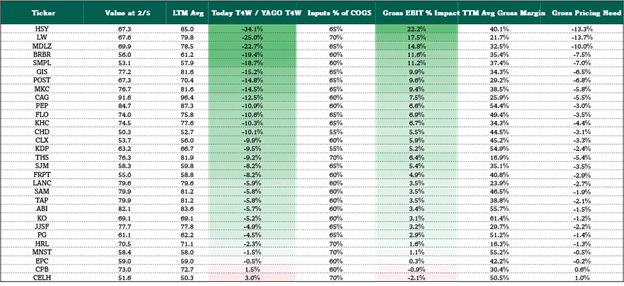
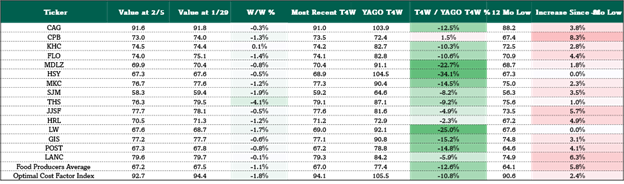
- Give a measurable H1 EPS tailwind to otherwise challenged CPG companies (HSY, MDLZ most) relative to planning period (early fall) expectations. See Fig 2.
- Help restaurant (YUM, DRI, CMG, CAVA) margins and/or provide fuel for traffic driving spend like larger protein portions and in app promotions.
- Challenge H1 2026 grocery comp both in perishables (KR, ACI) and stoking “select” price cuts (e.g. private label) as they chase traffic.
- Enhance center store grocery wallet through lower perishables spend (e.g. milk, meat, eggs), where input costs pass through directly.
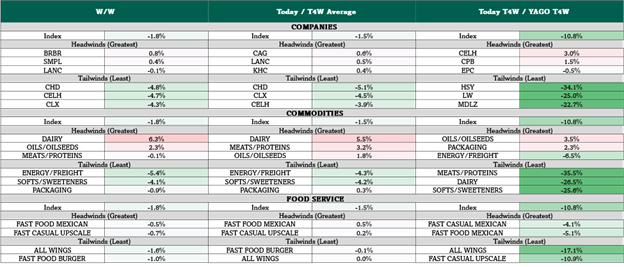
Cost tailwinds to watch: Meats/Proteins down -35.5% y/y, HSY -34.1% y/y, LW -25.0% y/y, Wing restaurants -17.1% y/y. See Fig 1.
Cost headwinds to watch: Oil/oilseeds (+2.3% w/w, +3.5% y/y), CELH +3.0% y/y, CPB +1.5% y/y. See Fig 1.
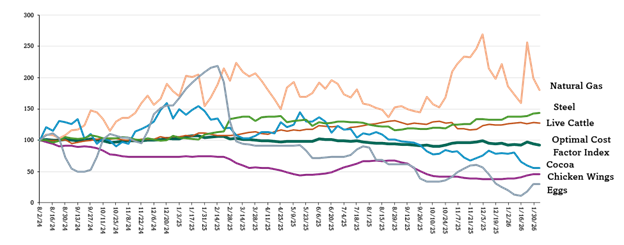
HSY and MDLZ leaders in gross EBIT impact of lower input costs. Commodity tailwinds continuing this week for Cocoa exposed companies, Cocoa down -30.7% m/m, and down -58.0% y/y. (See Fig 2.) This week’s better than expected HSY 2026 guidance reported this week ($8.36 midpoint vs consensus $7.08) driven largely by costs relative to plan. We expect more ahead.
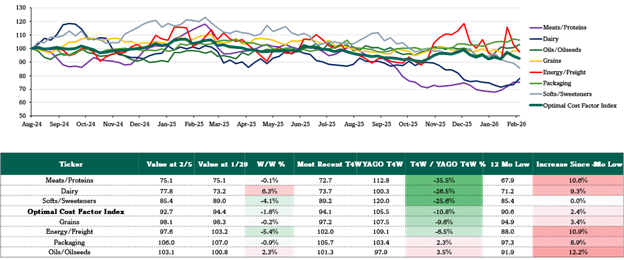
Animal products such as Meats/Protein & Dairy jump higher but still down y/y. Protein & Dairy input costs higher m/m but continue to lead as cost tailwinds across Chicken Breast (+16.1% m/m, -13.1% y/y), Wings (+18.9% m/m, -38.3% y/y), Eggs (+124.0% m/m, -86.2% y/y), Milk (+4.1% m/m, -23.0% y/y), and Cheese (+10.3% m/m, -21.1% y/y). Short term headwinds will need to continue to stack before said input costs move from helping to a hinderance. See Fig 3.
Cost Factor -1.8% w/w, -10.8% y/y (vs. prior week -3.2% w/w & -10.8% y/y). After working through winter weather and energy volatility, cost factor trending lower w/w for two consecutive weeks. Input costs down double-digits y/y since mid-January.
In this weekly note, we identify spot input costs’ putative impact on the U.S. fast moving consumer goods (FMCG) value chain, most measurably impacting staples, staples retailers, restaurants & food service. Optimal’s proprietary cost factor weights ticker & sector specific cost trends using a proprietary formula based on 32 trackable spot cost inputs – 23 of which are updated as of last night, the other 9 are latest available.
Figure 1: Weekly Cost Factor Summary
Sources: Optimal Advisory Proprietary Analysis, Bloomberg, FRED, USDA, BEA
Figure 2: Weekly Cost Factor Margin Context
Sources: Optimal Advisory Proprietary Analysis, Bloomberg, FRED, USDA, BEA
Figure 3: Weekly Input Commodity Performance by Group
Sources: Optimal Advisory Proprietary Analysis, Bloomberg, FRED, USDA, BEA
Figure 4: Biggest Input Cost Movers y/y
Sources: Optimal Advisory Proprietary Analysis, Bloomberg, FRED, USDA, BEA
Figure 5: Food Sector Cost Factor
Sources: Optimal Advisory Proprietary Analysis, Bloomberg, FRED, USDA, BEA
Figure 6: Beverage Sector Cost Factor

Sources: Optimal Advisory Proprietary Analysis, Bloomberg, FRED, USDA, BEA
Figure 7: HPC Sector Cost Factor

Sources: Optimal Advisory Proprietary Analysis, Bloomberg, FRED, USDA, BEA
Figure 8: Restaurant Level Cost Factor

Sources: Optimal Advisory Proprietary Analysis, Bloomberg, FRED, USDA, BEA
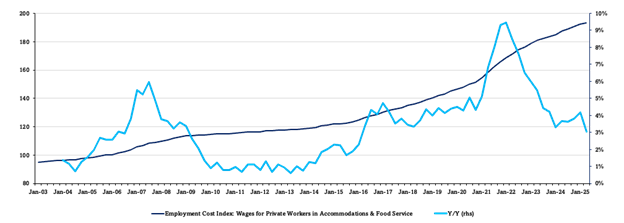
Figure 9: Restaurant Employment Cost Index
Sources: Optimal Advisory Proprietary Analysis, Bloomberg, FRED, USDA, BEA
Figure 10: Staples Sector Theme Box
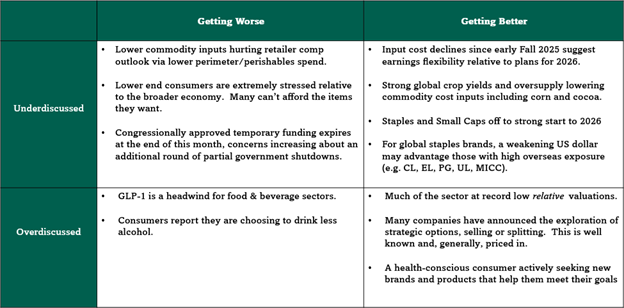
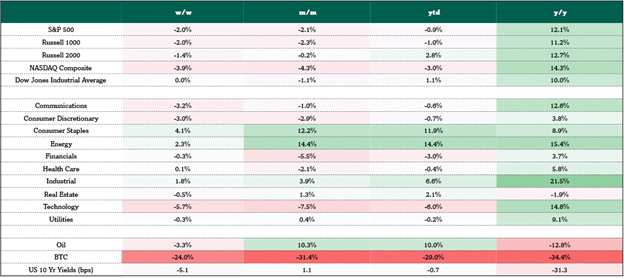
Figure 11: Market Sector Performance
Sources: Optimal Advisory Proprietary Analysis, Bloomberg