Input Costs Flat w/w, +4.0% y/y as Packaging & Energy Ease, Cocoa Bounce; Key Grocery Perishables Deflationary. HSY+, LW+, MDLZ+, EPC-, PG-, KR-
The Optimal Advisory Cost Factor was flat but decelerated on a y/y basis for the fourth consecutive week. It had accelerated for 15 consecutive weeks after the breakout of the Iranian conflict. For the year, costs are up slightly (+4.0% y/y) on energy and packaging, now ~15% off February lows -still a challenge to many outlooks. While down y/y, softs, sweeteners, and grains all bounced w/w while the inflationary energy/packaging complex eased.
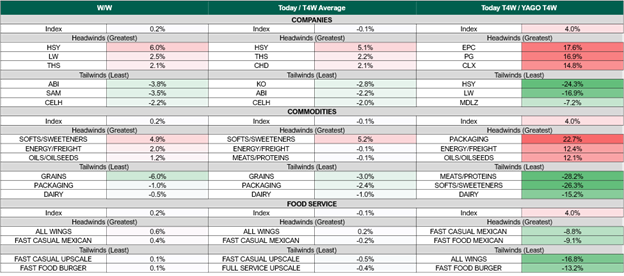
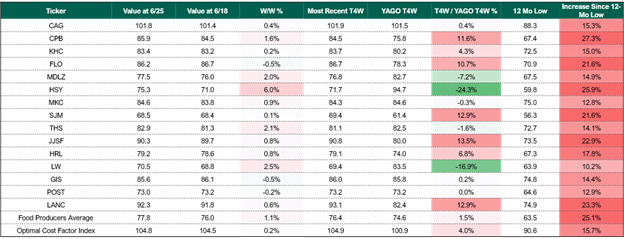
Cost tailwinds to watch: Meats/Proteins -28.2%, Softs/Sweeteners down -26.3% y/y, HSY -24.3% y/y, LW –16.9% y/y, MDLZ -7.2% y/y, Grains -6.0% w/w. See Fig 1.
Cost headwinds to watch: Packaging +22.7% y/y, Energy/Freight +12.4% y/y, EPC +17.6% y/y, PG -16.9% y/y, Softs/Sweeteners +4.9% w/w. See Fig 1.
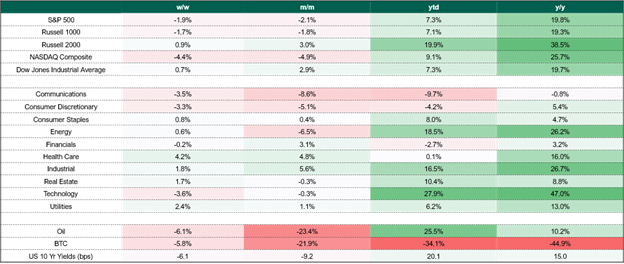
Higher energy costs & shipping risk are implicitly an immediate tax on everything: Within COGS, they drive the cost of packaging (esp. aluminum), inbound & outbound freight as well as farm level costs (diesel, fertilizer) that are key to plantings, supply & future food inputs. Within SG&A, they drive delivery costs. They also threaten revenue with more consumer budget constraints. We monitor weekly performance of key equity indices and macro indicators. See Fig 11.
Crude lower. WTI dropped to near $70 a barrel, its lowest level since March as shipping traffic is approaching pre-conflict levels – a marginal tailwind for outlooks in HPC and staples companies broadly.
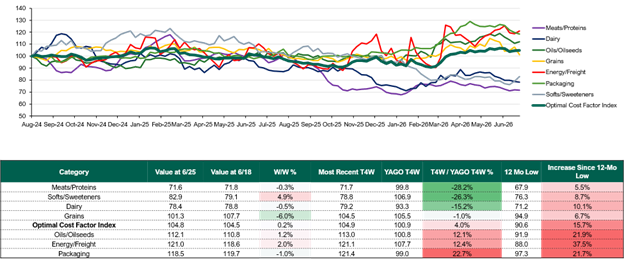
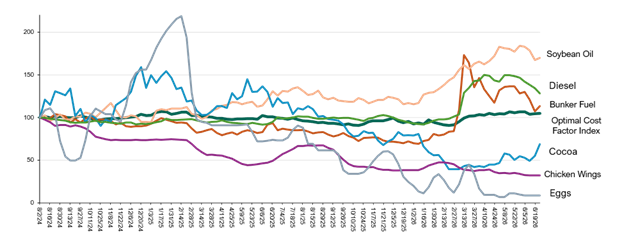
Cost Factor +0.2% w/w, +4.0% y/y (vs. prior week +1.3% w/w & +5.0% y/y). Notable commodity moves this week include Cocoa up +20% w/w (although still down -44% y/y) and at the highest levels since January, driven by short covering and weather-related supply concerns.
In this weekly note, we identify spot input costs’ putative impact on the U.S. fast moving consumer goods (FMCG) value chain, most measurably impacting staples, staples retailers, restaurants & food service. Optimal’s proprietary cost factor weights ticker & sector specific cost trends using a proprietary formula based on 32 trackable spot cost inputs – 23 of which are updated as of last night, the other 9 are latest available.
Figure 1: Weekly Cost Factor Summary
Sources: Optimal Advisory Proprietary Analysis, Bloomberg, FRED, USDA, BEA
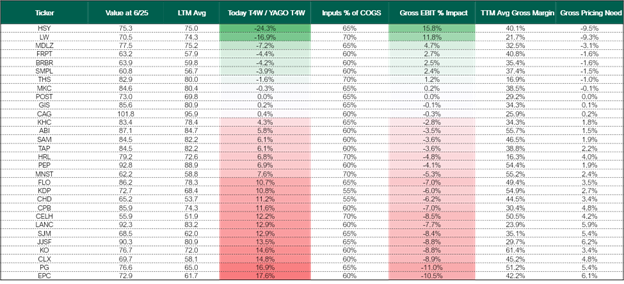
Figure 2: Weekly Cost Factor Margin Context
Sources: Optimal Advisory Proprietary Analysis, Bloomberg, FRED, USDA, BEA
Figure 3: Weekly Input Commodity Performance by Group
Sources: Optimal Advisory Proprietary Analysis, Bloomberg, FRED, USDA, BEA
Figure 4: Biggest Input Cost Movers y/y
Sources: Optimal Advisory Proprietary Analysis, Bloomberg, FRED, USDA, BEA
Figure 5: Food Sector Cost Factor
Sources: Optimal Advisory Proprietary Analysis, Bloomberg, FRED, USDA, BEA
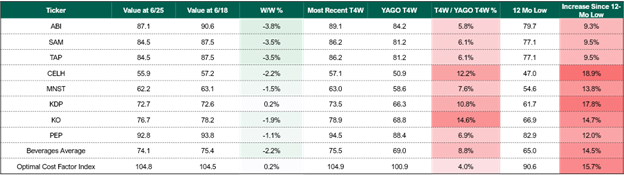
Figure 6: Beverage Sector Cost Factor
Sources: Optimal Advisory Proprietary Analysis, Bloomberg, FRED, USDA, BEA
Figure 7: HPC Sector Cost Factor

Sources: Optimal Advisory Proprietary Analysis, Bloomberg, FRED, USDA, BEA
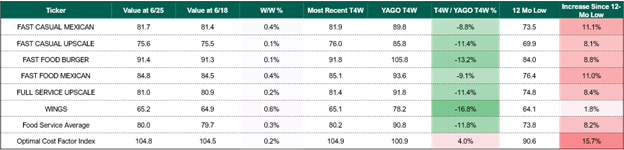
Figure 8: Restaurant Level Cost Factor
Sources: Optimal Advisory Proprietary Analysis, Bloomberg, FRED, USDA, BEA
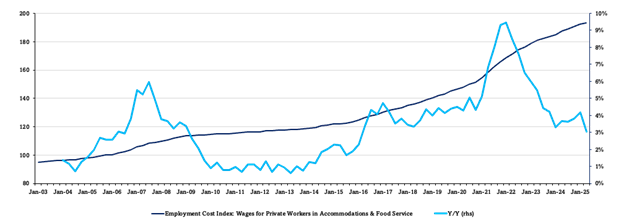
Figure 9: Restaurant Employment Cost Index
Sources: Optimal Advisory Proprietary Analysis, Bloomberg, FRED, USDA, BEA
Figure 10: Staples Sector Theme Box
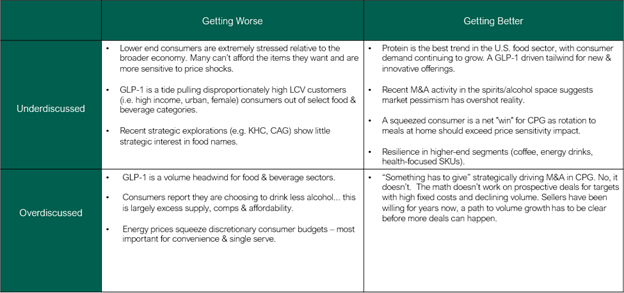
Figure 11: Market Sector Performance
Sources: Optimal Advisory Proprietary Analysis, Bloomberg