January Analysis across 91 Retailers, Brands, Travel, and Transports: Consumer AI-Driven Inflection & Importance
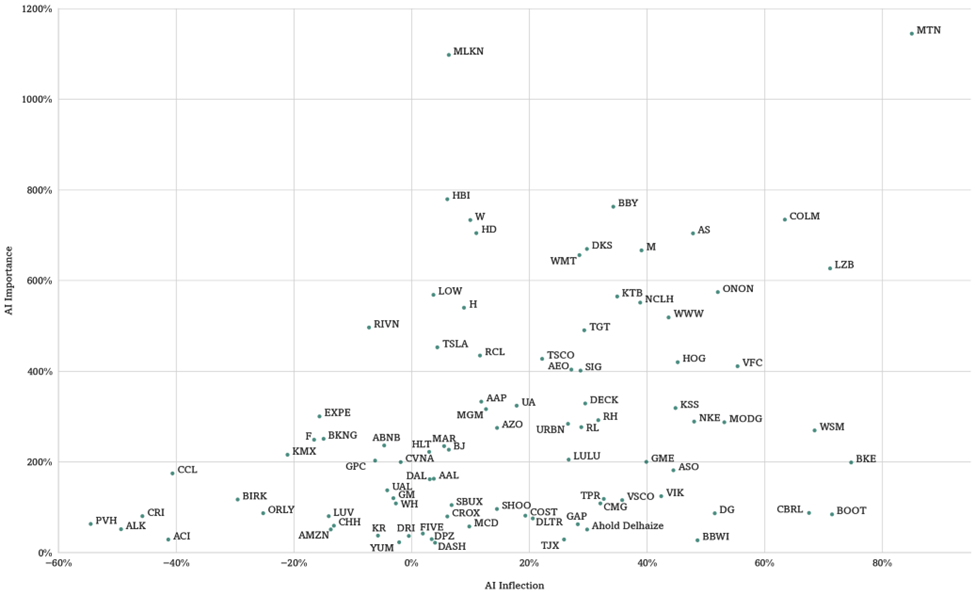
In this January report, we update our analysis across 91 consumer names (see Figure 1). We calculate both (a) the relative inflection of AI-driven traffic (visits to a website driven by AI platforms) and (b) the importance of AI engagement within the context of digital engagement of consumers (a measure of how much of a brand’s traffic is driven by AI platforms). These AI platforms are increasingly driving consumer choices, though we note growth is leveling off (see Figure 9).
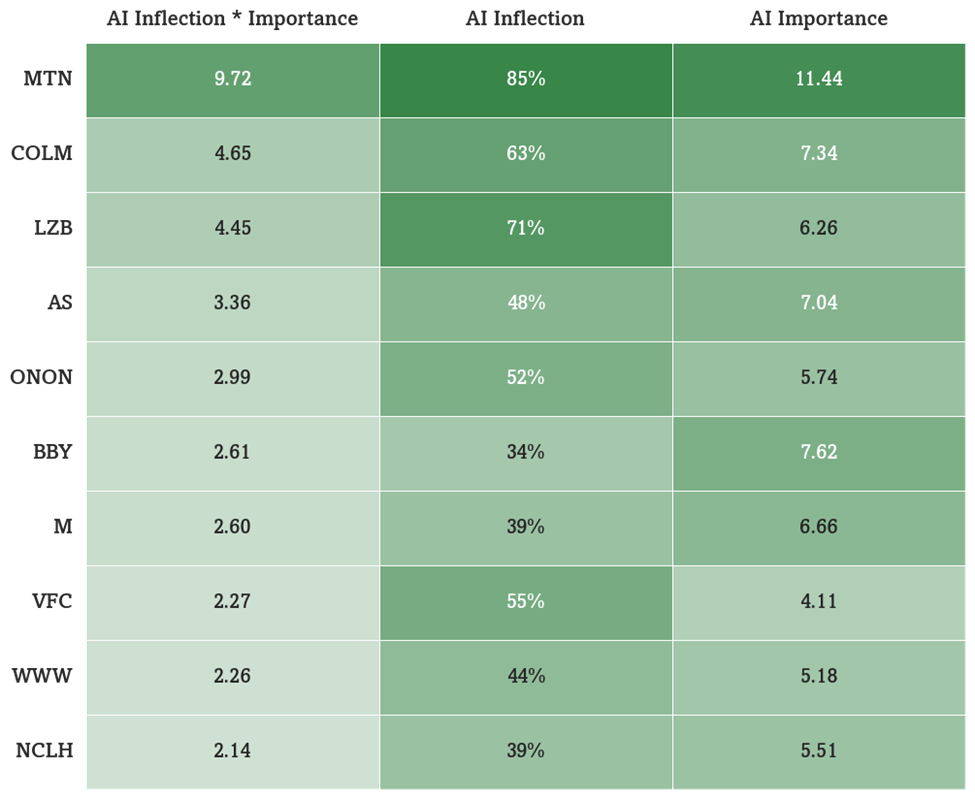
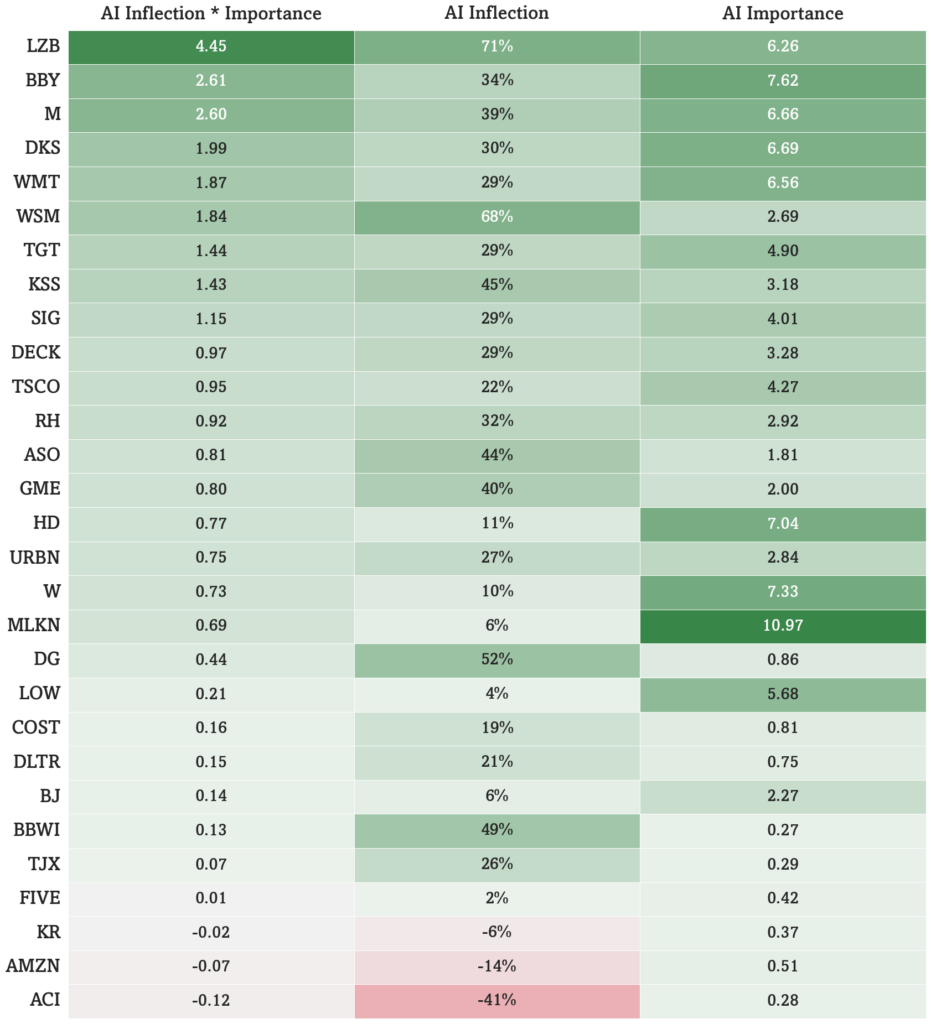
Key Callouts: MTN leads in importance and inflection. BKE, BOOT, LZB, WSM show high inflections while MLKN, HBI, BBY, W, COLM show high importance. RIVN, EXPE, F, BKNG, ABNB are brands with negative inflections but higher importance. AMZN continues to show both low inflection and importance of AI-driven traffic. In the below charts, we rank AI inflection and importance across 89 names in Retail, Restaurants, Leisure / Travel, Autos, and Apparel.
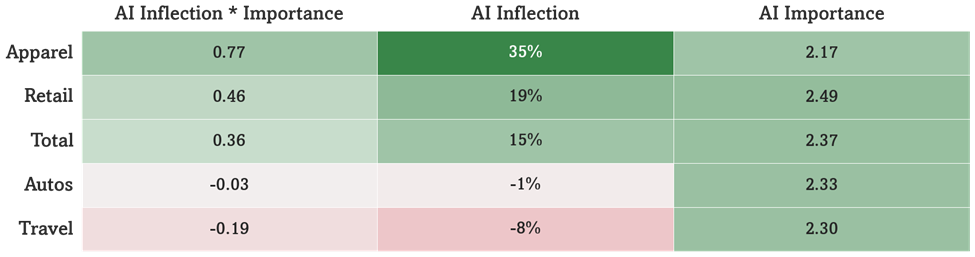
Categories: Apparel & Golf leads (led by COLM, AS, ONON), followed by Retailers (LZB, BBY, M), Automotive (HOG, AZO, AAP) and Leisure, Accommodations, & Travel (MTN, NCLH, VIK). Automotive and Leisure, Accommodations, & Travel have negatively inflected (see Figure 2).
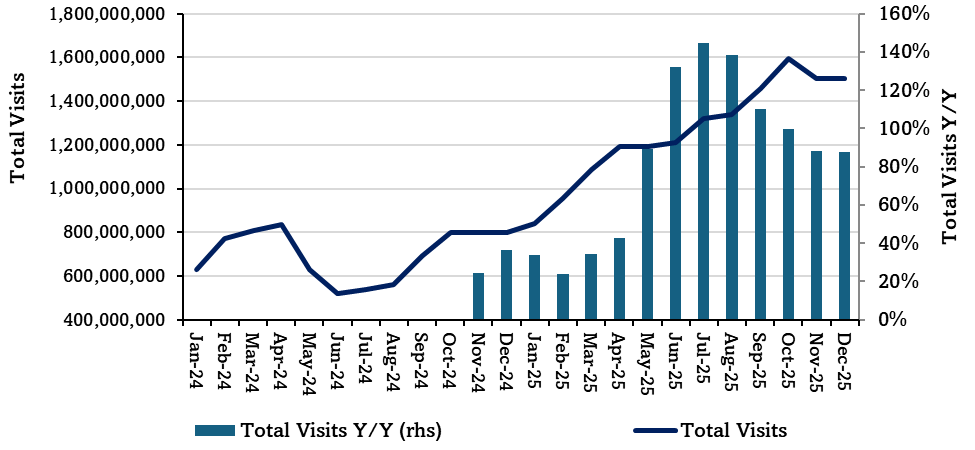
Consumers are increasingly using AI platforms, but we note slowing growth in a recent drop from October and deceleration since August (see Figure 9). 74% of the age 18-29 cohort use AI “at least several times a week” compared to 46% of the 65+ cohort, according to Pew Research (see Figure 8). We also believe traction in AI can imply other strengths (on trend, marketing, digital capabilities). The opposite may also be true.
Figure 1: Measuring Inflection and Importance of AI Across Consumer, January 2025
Source: Optimal Advisory analysis, Similarweb
Figure 2: AI Inflection * Importance by Category, January 2025
Source: Optimal Advisory analysis, Similarweb
Figure 3: Top 10 AI Inflection * Importance, January 2025
Source: Optimal Advisory analysis, Similarweb
Figure 4: Retailers, January 2025
Source: Optimal Advisory analysis, Similarweb
Figure 5: Leisure, Accommodations, & Travel, January 2025
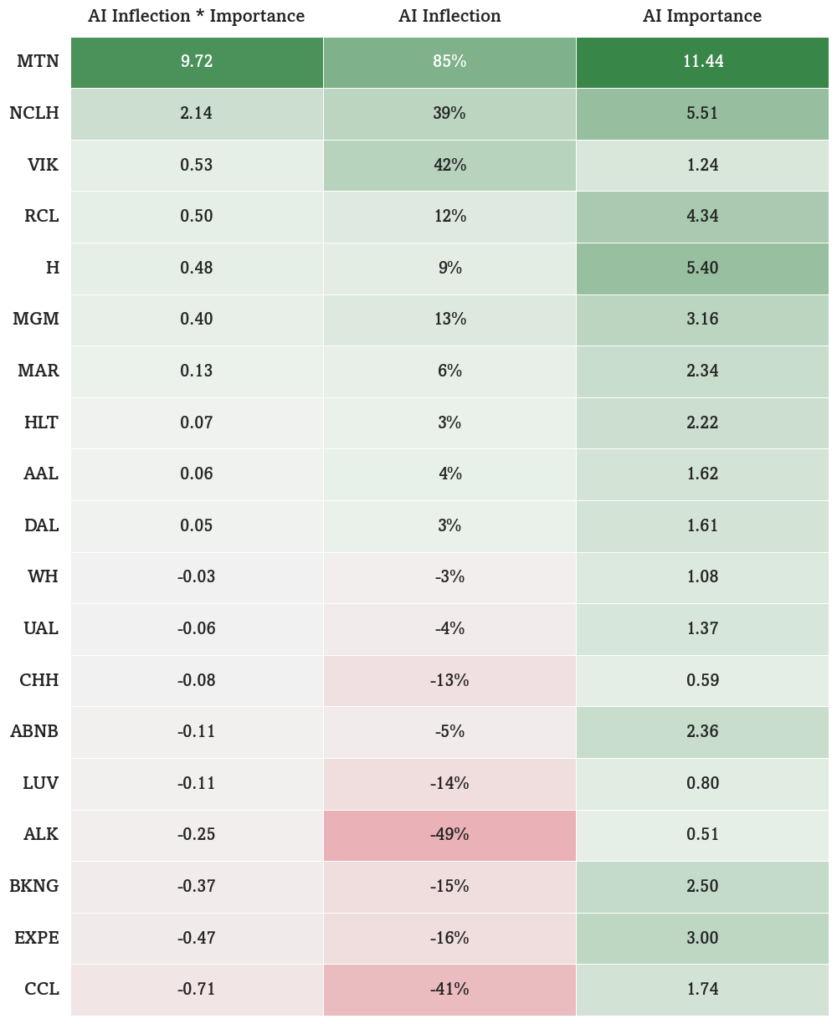
Source: Optimal Advisory analysis, Similarweb
Figure 6: Automotive, January 2025
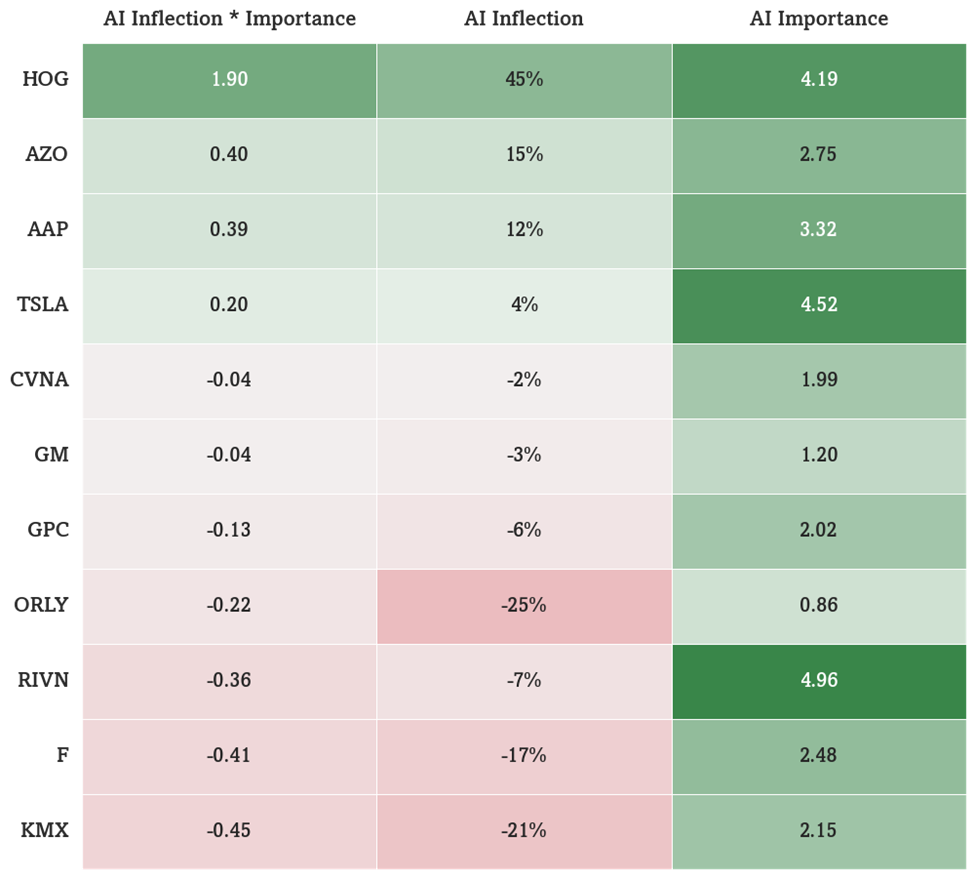
Source: Optimal Advisory analysis, Similarweb
Figure 7: Apparel & Golf, January 2025
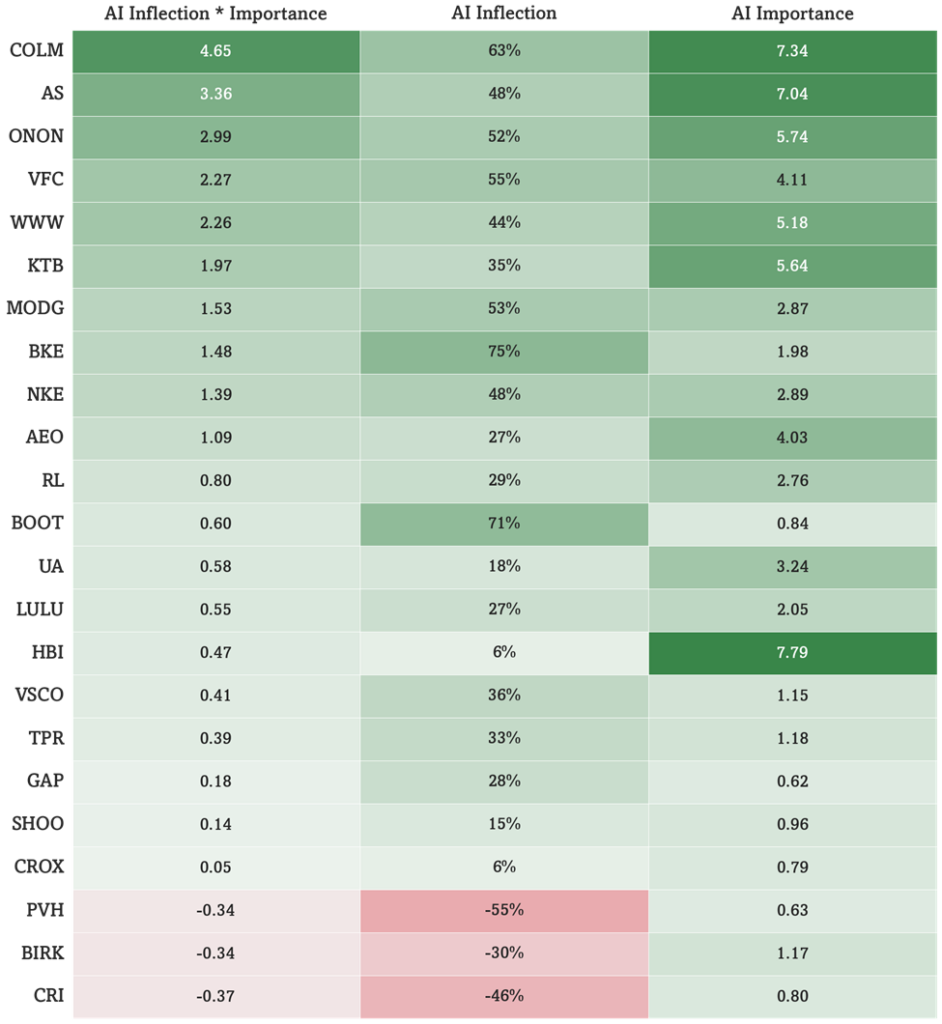
Source: Optimal Advisory analysis, Similarweb
Figure 8: Demographics of AI Consumer Use
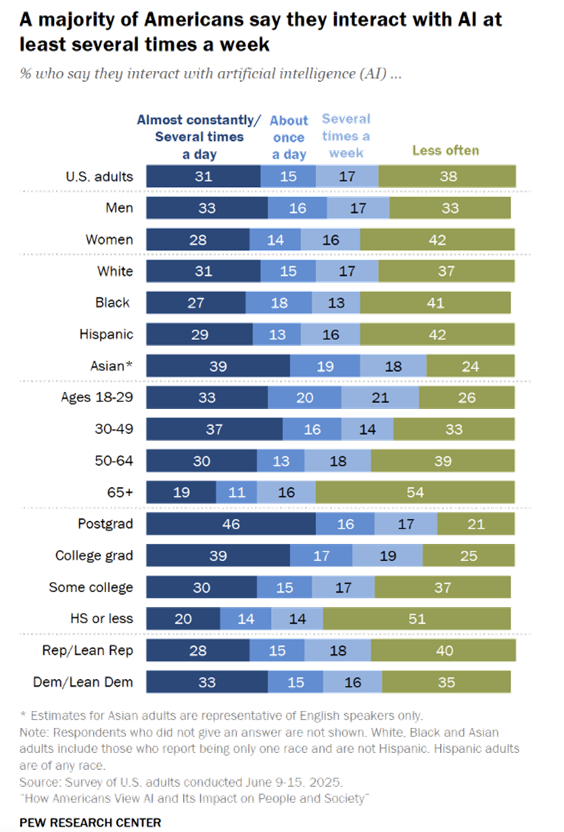
Source: Pew Research
Figure 9: AI Chatbot & Tools Digital Visits
Source: Optimal Advisory analysis, Similarweb