Jersey Mike’s Lens: Geographic Momentum / Recent Trend Analysis / Favorite Sandwich
Summary: In this report we analyze (a) the health of metro markets crossed with Jersey Mike’s geographic concentration; (b) brand traction of JMKE and its peer set; (c) a detailed cross-section of recent trends at JMKE and peers; and (d) demographic comparisons across peers. We continue to field strategy, positioning, and execution questions on the quick-serve and fast casual space. We also note, for the record … “Jersey’s Shore Favorite, the #2” is our favorite item from our channel checks (and also was prior to our official channel checks).
Real Estate Analysis
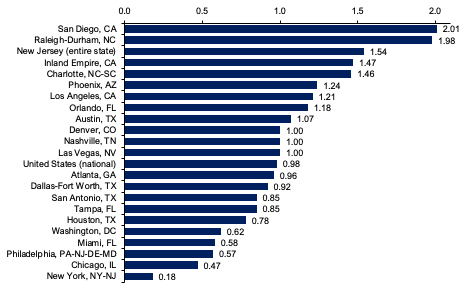
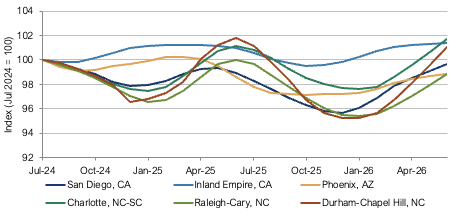
We compiled and analyzed location data for over 3,300 Jersey Mike’s stores to understand saturation and opportunity. The metro areas with the greatest concentration of stores per capita are exhibited below. We then calculate real-time housing pricing data as a lens household spending health in these key markets. Home prices are broadly stable on the 1- and 2-year stack, while among motivated sellers, we monitor days on market and price cuts.
Jersey Mike’s Locations per 100,000 Residents by Metro Area (2025)
Sources: Optimal Advisory Analysis, Jersey Mike’s, US Census Bureau
Home-price momentum – Indexed to 100 at July 2024
Sources: Optimal Advisory Analysis, Parcl
Brand Traction
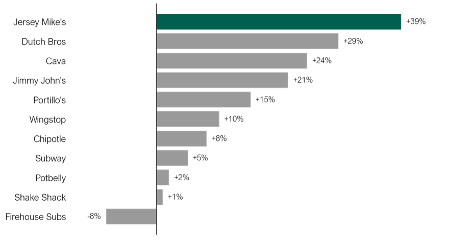
Jersey Mike’s is the fastest-growing brand in our analysis of digital traction (+39% y/y) and the second-largest sub brand by visits, behind Subway. Monthly visits climbed through the first half of 2026 to a June record, a useful tailwind into the listing.
Monthly Digital Visits, Y/Y
Sources: Optimal Advisory Analysis, Similarweb
Digital Monthly Visitors per Store, Peer Set

Sources: Optimal Advisory Analysis, company reports, Similarweb
Trend Overview Versus Peers
Below we display trailing three-month y/y across eight metrics, sorted by revenue growth, as of June 2026. Jersey Mike’s posts the broadest growth in the sub tier and is positive on every metric. Only Cava, and Shake Shack on some measures, have more robust trends. Jimmy John’s, Wingstop and Panera are showing headwinds.
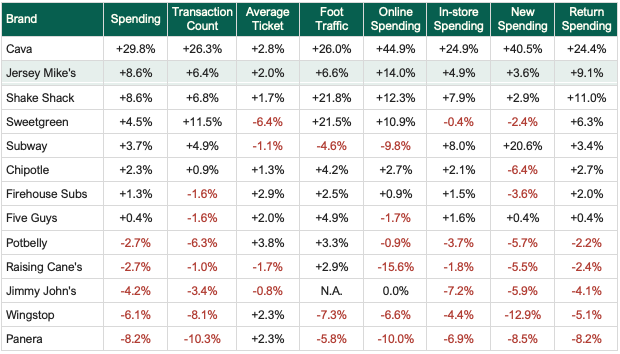
Latest three-month year-over-year, as of June 2026. Positive = growth. Third-party card-panel demand proxy, not company-reported figures.
Sources: Optimal Advisory Analysis, Bloomberg Second Measure, Placer.ai
Relative Spending Trends
Jersey Mike’s has out-grown Subway, Chipotle and Firehouse almost continuously (green is relative strength, where JMKE is growing revenue faster – footage growth is a relative driver here, though rate of change of that contribution is fairly static). The Subway lead narrowed to a few points in early 2026, then re-widened; dips below Chipotle and Firehouse were brief.
Jersey Mike’s v Subway, Revenue Y/Y (ppt)
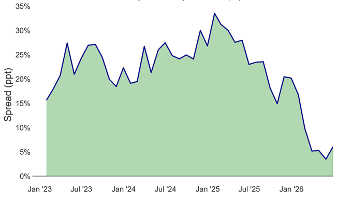
Sources: Optimal Advisory Analysis, Bloomberg Second Measure
Jersey Mike’s v Chipotle, Revenue Y/Y (ppt)
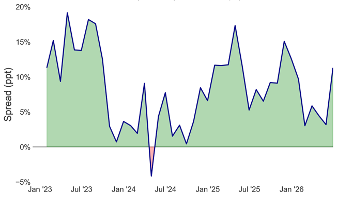
Sources: Optimal Advisory Analysis, Bloomberg Second Measure
Jersey Mike’s vs Firehouse, Revenue Y/Y (ppt)
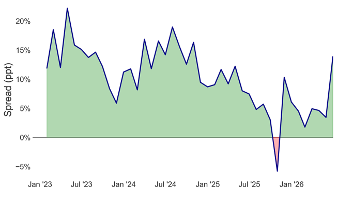
Sources: Optimal Advisory Analysis, Bloomberg Second Measure
Spending Trend Analysis
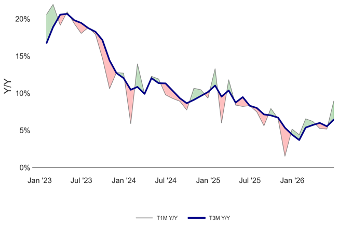
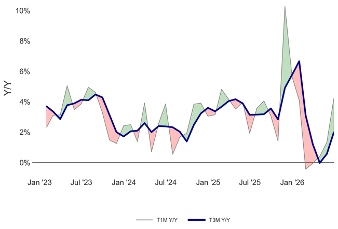
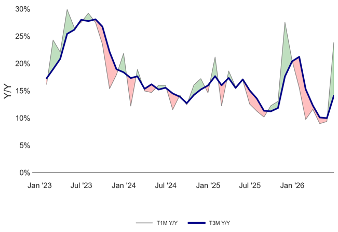
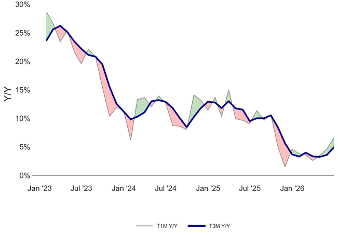
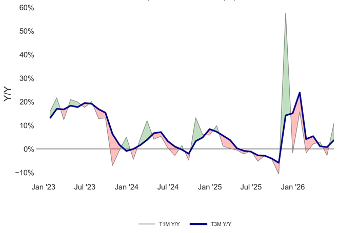
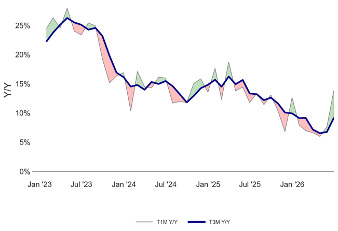
Spending trend analysis shows Jersey Mike’s leading fast casual & sub sandwich peers in growth. Recent months turned back up, and the ~8 to 13% card read squares with the ~11% reported FY2025 revenue. Returning customers are the majority of sales and have a similar trend to total sales. New-customer sales stalled through 2025, then inflected sharply upward in early 2026.
Revenue Trend, Y/Y
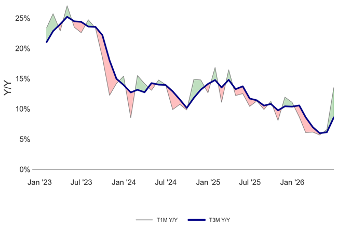
Sources: Optimal Advisory Analysis, Bloomberg Second Measure
Transactions, Y/Y
Sources: Optimal Advisory Analysis, Bloomberg Second Measure
Average Ticket, Y/Y
Sources: Optimal Advisory Analysis, Bloomberg Second Measure
Online Sales, Y/Y
Sources: Optimal Advisory Analysis, Bloomberg Second Measure
In-store Sales, Y/Y
Sources: Optimal Advisory Analysis, Bloomberg Second Measure
New-Customer Sales, Y/Y
Sources: Optimal Advisory Analysis, Bloomberg Second Measure
Returning-Customer Sales, Y/Y
Sources: Optimal Advisory Analysis, Bloomberg Second Measure
Digital Audience and Inflections
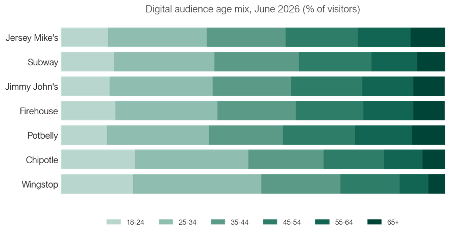
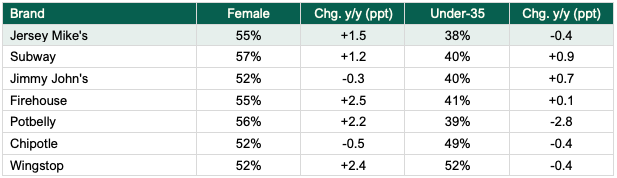
The online audience skews slightly female (~55%) and spreads evenly across ages, older than Chipotle and Wingstop but typical for the tier. Year on year it tilted a touch more female, as did most peers, and aged mildly, so the under-35 share eased.
Digital Audience Age Mix
Sources: Optimal Advisory Analysis, Similarweb
Female Share and Under-35 Share, with Year-over-Year Change
Sources: Optimal Advisory Analysis, Similarweb