Jobless Claims Bulls Don’t Understand the New Economy; Metro Markets With Momentum & Pressure; Our Consumer Spending Tracker Remains Muted: Macro Monday on Sunday
Summary: (1) We explain how decoupled jobless claims are now from reality and which metro markets have momentum and pressure (see Charts of the Week); (2) Our math shows Consumer Velocity continuing to decel sharply on both short- and long-term averages this week and is now negative y/y, see Fig 1; (3) Home borrowing costs remain elevated, with the 30Y FRM at 6.58% (last below 6% in Fall 2022), see Fig 3-6; (4) Gas prices remain in flux as middle east volatility picks up again, gas inflation re-accelerated with the T4W back to +48% y/y and remains the dominant macro signal, see Fig 7; (5) Sentiment continued higher m/m, now two months off May’s all-time low (44.8), see Fig 9-12; and (6) the Wealth Effect Index decelerated for the sixth straight week, see Fig 13-16.
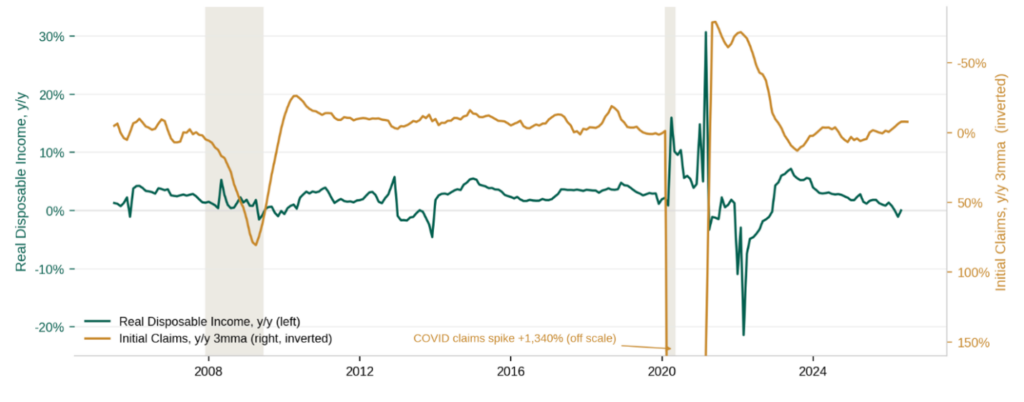
Chart of the Week: Jobless Claims Say Strength, We Say They Aren’t Useful Anymore
Our analytics, trained models, and channel checks all suggest a subdued consumer with the incremental shifts and risks to the downside. This past week we heard, once again, the chorus of “initial jobless claims are falling” bulls. We do, of course, track initial and continuing claims. For decades it was a predictive inverse indicator to real disposable income – with a best fit lag of 7 months (7 months after an inflection towards higher jobless claims RDI would tend to inflect lower, for example). But this is broken, and it is not COVID changes to the economy in our view, it’s gig work as the fallback. Underemployment is the new unemployment – and app-based jobs empower that. Gig economy jobs like delivery, ride platforms, or remote freelance allow for a slower economy without Americans lining up for unemployment claims.
Source: Optimal Advisory analysis, FRED
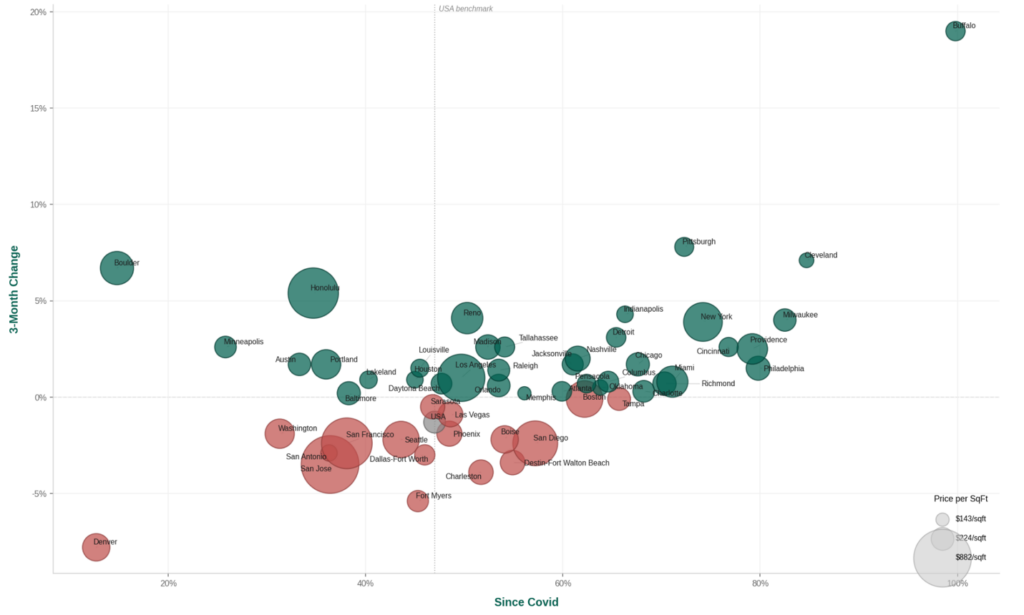
Chart of the Week: Metro Market Analysis
We are running analysis on daily home price and markdown data to understand positioning of fast casual, quick serve, grocery, and other retail categories. We used some of this work in our JMKE analysis. In this chart we cross recent price momentum with price changes since Covid and market-level price per foot. Please connect with us for this overlay across specific companies.
Source: Optimal Advisory Analysis, Parcl
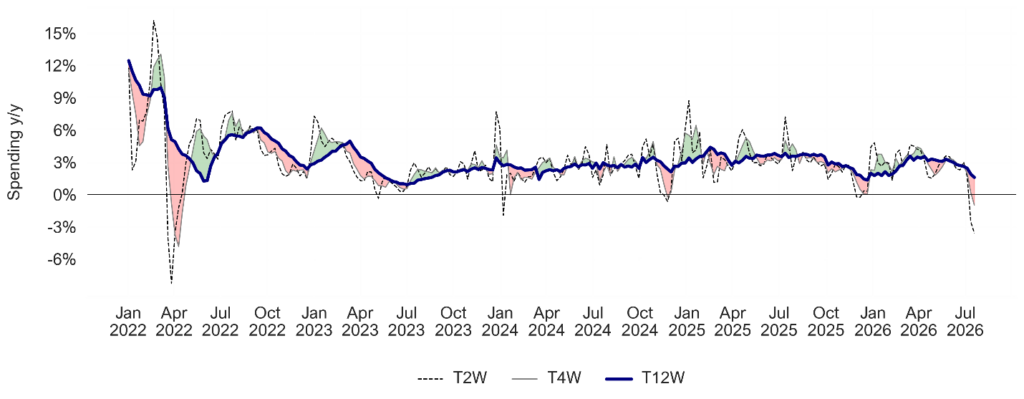
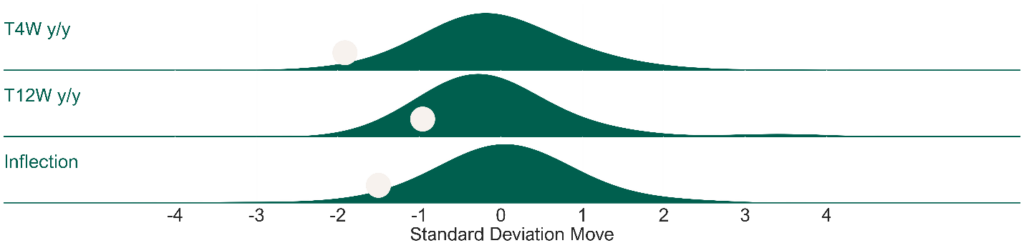
Our Consumer Velocity tracker weakened further this week, with the T4W decelerating to -1.0% y/y (from +0.2% the prior week) and the T12W to +1.6% y/y (from +1.9%). The underlying trend is now 1.9 standard deviations below the post-2022 average on a T4W basis and 1.0 on a T12W basis. The T4W vs. T12W inflection was -2.6 pts, the third consecutive week (and 6th of the last 10 weeks) of shorter-term growth lagging longer-term, with the gap widening from -1.7 pts last week to reach its lowest level since November 2024. See Fig 1-2.
Housing borrowing costs remain elevated; inventory holding steady. US 30Y FRM rate is up to 6.58%, running down -21 bps y/y on a T4W basis (0.3 standard deviations below average since 2020). MBA’s mortgage applications for purchase index is running up 4% y/y while refinance applications index is also up 4.5% y/y. Median home prices & inventory are slightly up y/y. Roughly 18% of US GDP is related to the selling, building, fixing, lending to, and furnishing of homes – velocity matters for the economy. See Fig 3-6.
Gasoline inflation accelerated further this week, with the weekly print rising to +62% y/y (accelerating from +58%) and the T4W accelerating to +48% y/y (from +43%), while the T12W decelerated slightly to +50% y/y (from +51%). The T4W trend is 0.9 standard deviations above average, and the T4W vs. T12W inflection narrowed to -1.8 pts (from -8.0) as shorter-term growth converged toward the longer-term trend. We continue to flag that utilities (electricity and heating fuel) run about 9% of lower-income household spending vs. 4% for higher-income households, compounding the squeeze at the bottom of the income distribution. See Fig 7-8.
Sentiment continued to recover off May’s all-time low (44.8), rising to 54.4 (from 49.5 in June), with headline Sentiment y/y accelerating to -12% y/y this month (from -18%). However, the T3M still decelerated to -15% y/y (1.2 standard deviations below average), while the T9M accelerated slightly to -17% y/y (1.6 standard deviations below average). Upper-third income Sentiment is down -9% y/y on a T3M basis (0.7 standard deviations below average), decelerating from -6% y/y T3M last month. Middle-income Sentiment is down -18% y/y on a T3M basis (1.4 standard deviations below average), decelerating from -17% y/y T3M last month, and lower-income Sentiment is down -20% y/y on a T3M basis (1.7 standard deviations below average), decelerating from -19% last month. We note the increase in sentiment was primarily driven by middle-third income (+26% m/m) and upper-third income (+10% m/m) consumers.
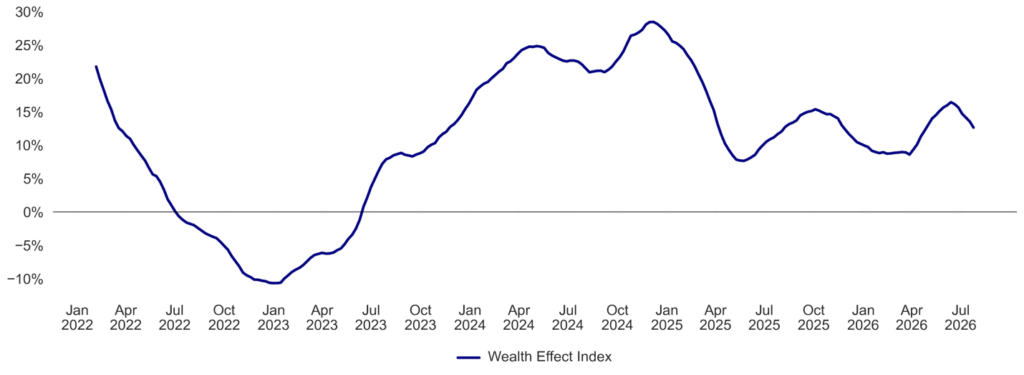
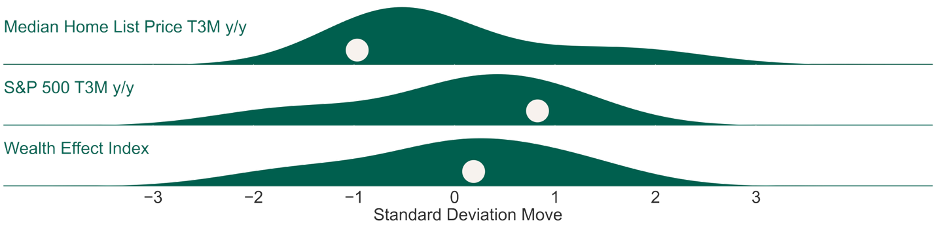
Consumer “Wealth Effect” continued to decelerate this week. Optimal Advisory’s Wealth Effect Index is at +12.6% y/y (decelerating for 6 consecutive weeks from +16.4% y/y peak in mid-June and 0.3 standard deviations above average since the start of 2022). With home prices slightly positive y/y we note the “flywheel” of wealth effect remains elevated but decelerating off equity returns. See Fig 13-16.
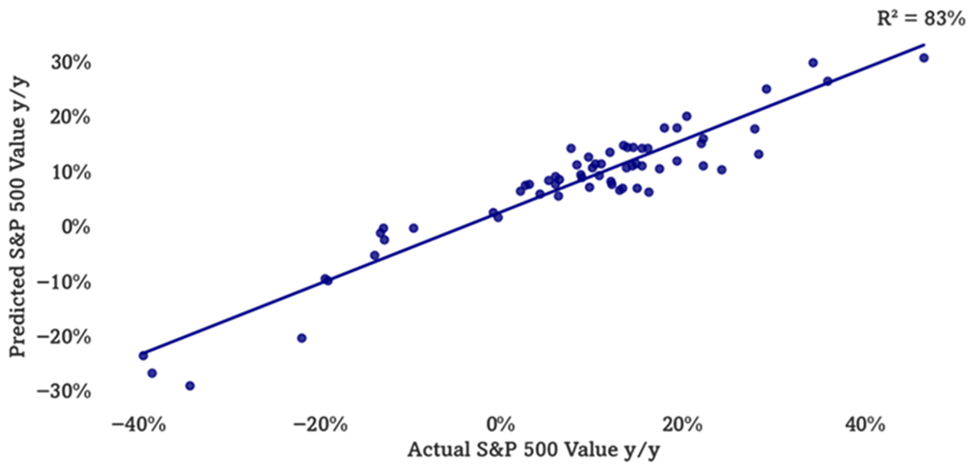
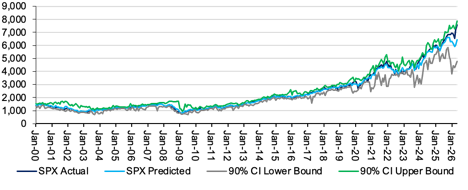
Our Multifactor Macro Market Model had been suggestive of March 2026 softness, rebound. Optimal’s Multifactor Macro Market Model projects the S&P 500 as well as bull and bear cases based on lagged data for 12 macroeconomic factors. The model suggested the S&P 500 to fall to just below 6000 by March, before rebounding back up to 6400 by May. We use this model as a guide to how macro would guide the market, given our analysis of current variables. This is, of course, outside of other factors at work. See Fig 17-18.
Figures 1-2: Optimal Advisory Consumer Velocity Monitor
Source: Optimal Advisory Analysis, Bloomberg Second Measure
Consumer Spending y/y Relative to Historical Average
Source: Optimal Advisory Analysis, Bloomberg Second Measure
Figures 3-6: Housing Kinetic Energy
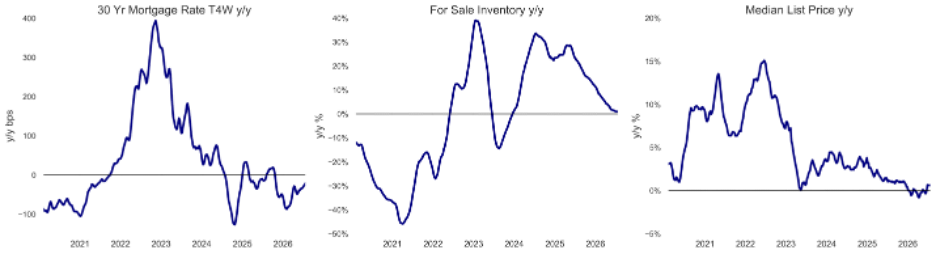
Source: Optimal Advisory Analysis, Freddie Mac, Zillow, Redfin
Mortgage Rates, For Sale Inventory, & Median List Price y/y Relative to Historical Averages (Since 2020)
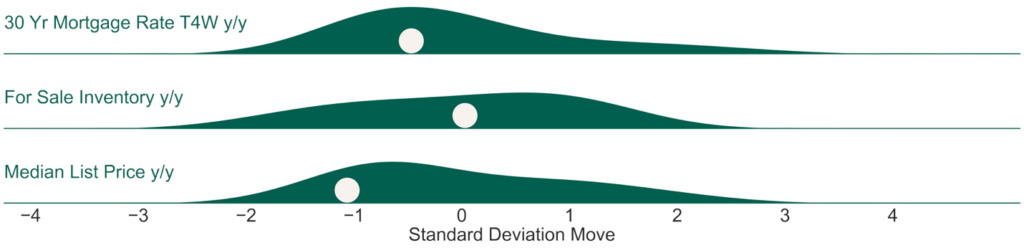
Source: Optimal Advisory Analysis, Freddie Mac, Zillow, Redfin
Figures 7-8: Gas Prices y/y
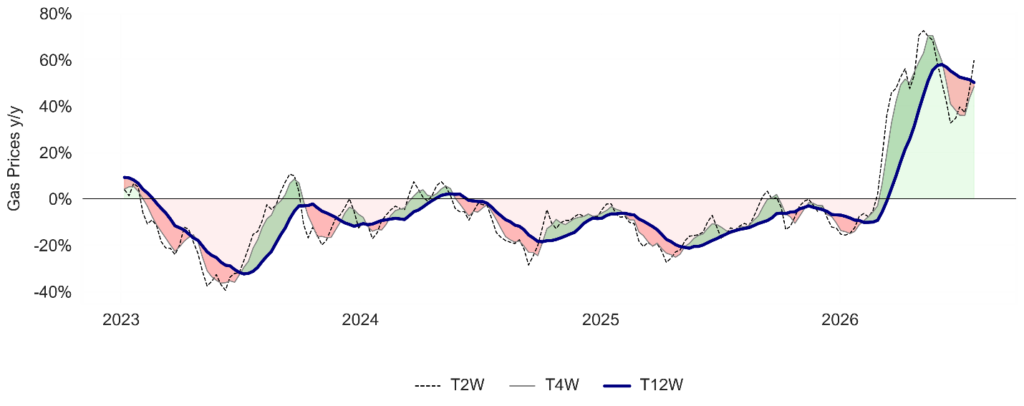
Source: Optimal Advisory Analysis, Bloomberg
Gas Prices y/y Relative to Historical Averages (Since 1992)
Source: Optimal Advisory Analysis, Bloomberg
Figures 9-12: Consumer Sentiment T3M and T9M y/y
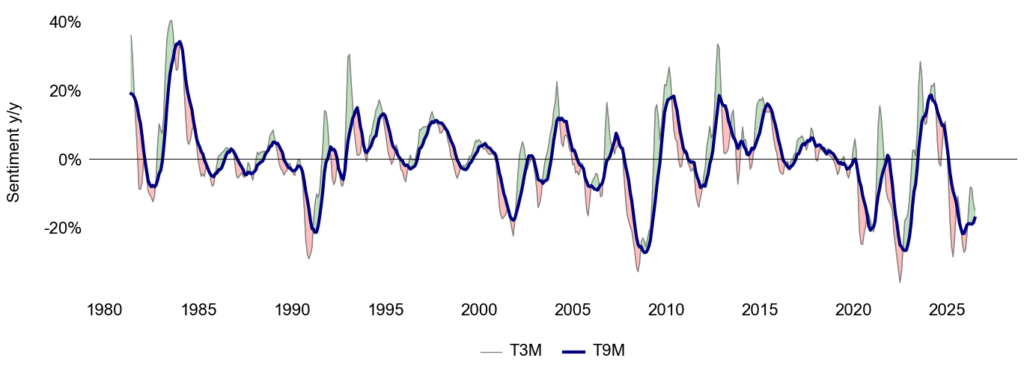
Sentiment y/y by Income Tercile
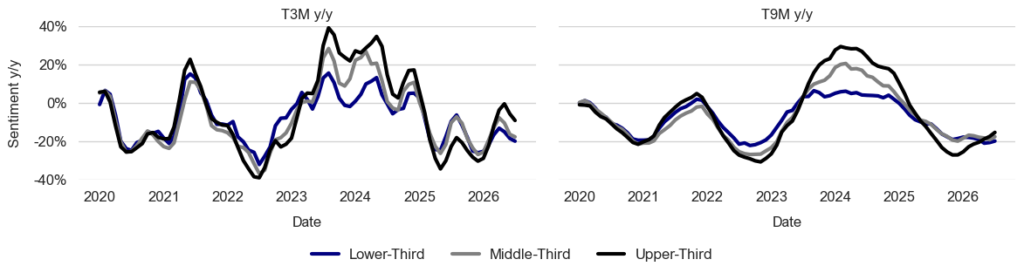
Comparison of Sentiment y/y Across Income Terciles
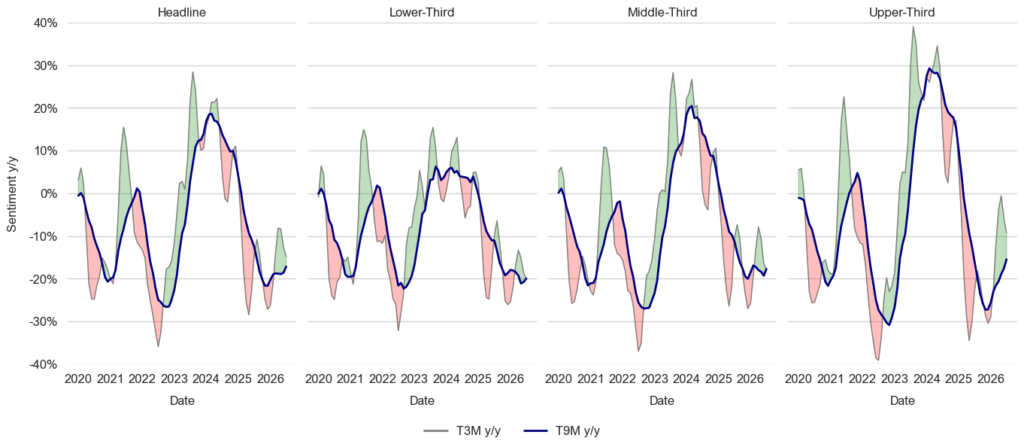
Source: Optimal Advisory Analysis, University of Michigan Consumer Survey
Figures 13-16: Consumer Wealth Effect & Components y/y
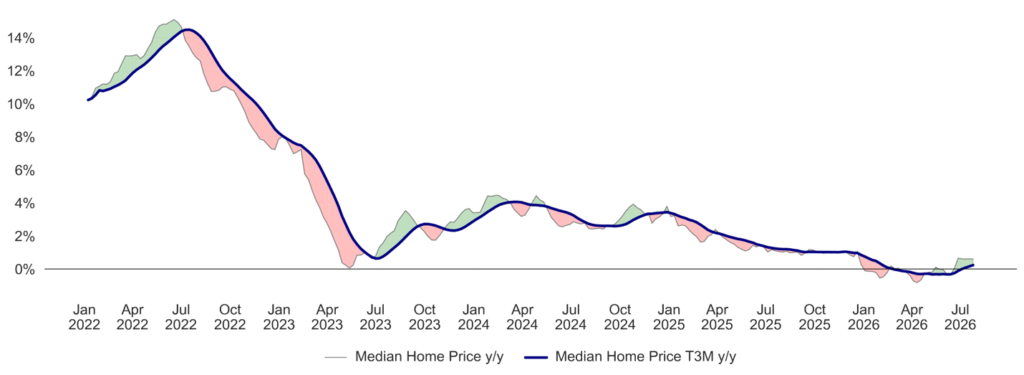
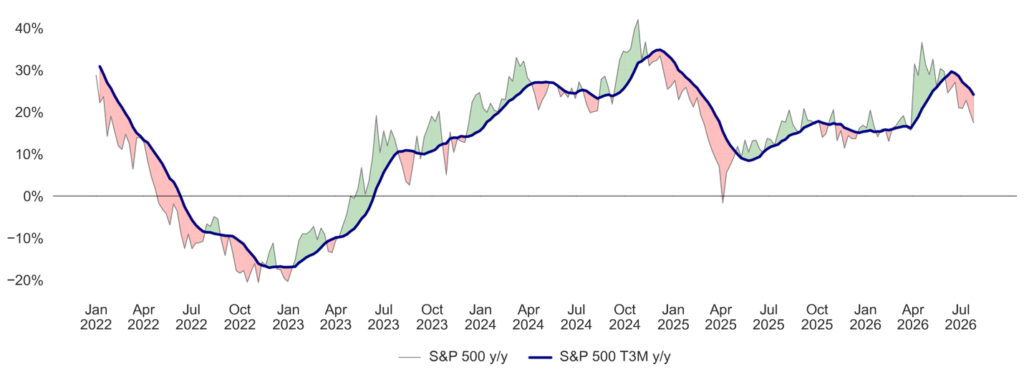
Source: Optimal Advisory Analysis, Bloomberg, Zillow, Redfin
Median Home Price y/y, S&P 500 y/y, & Wealth Effect Index (Since 2022)
Source: Optimal Advisory Analysis, Bloomberg, Zillow, Redfin
Figures 17-18: Optimal Advisory Multifactor Macro Market Model
Historical Test Predictions vs. Actual (On Test Data Only)
Source: Optimal Advisory Proprietary Analysis, Bloomberg, FRED, BLS, BEA, OECD, University of Michigan Consumer Sentiment Survey, U.S. Census Bureau, FRB
Actual & Projected S&P 500 (Including Training & Test Data) with Confidence Intervals
Source: Optimal Advisory Proprietary Analysis, Bloomberg, FRED, BLS, BEA, OECD, University of Michigan Consumer Sentiment Survey, U.S. Census Bureau, FRB
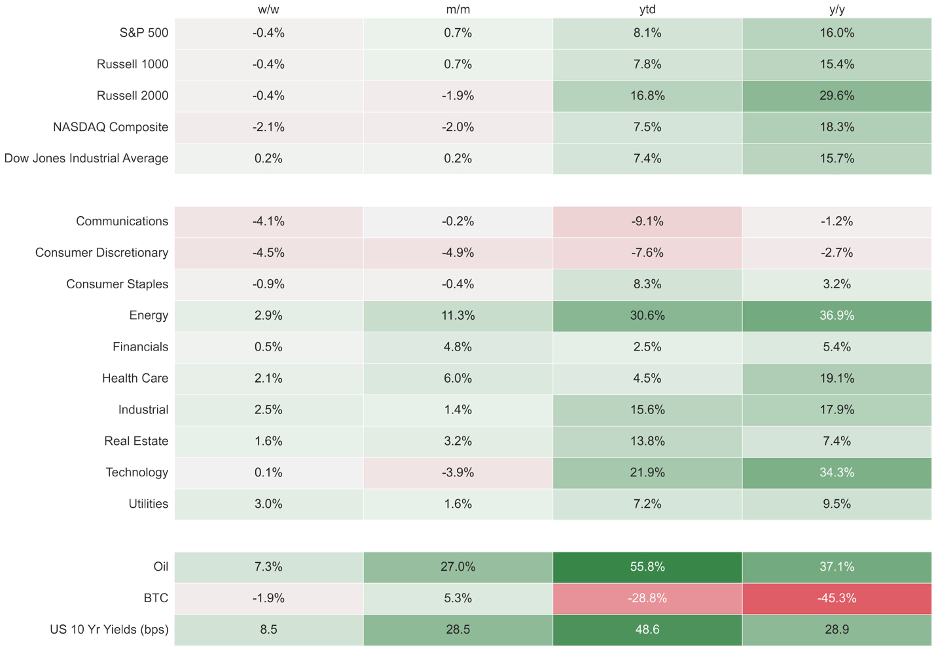
Figure 19: Index & Sector Performance
Source: Optimal Advisory Analysis, Bloomberg, prices at market close 7/24/2026