LTH & UAA Inflect; Sports Ecosystem Tracker Down but Stable; Betting Leads; NKE Digital Traffic Accelerates at Highest Levels Since 2023: The Optimal Sports Section
Sports Ecosystem trends stayed slightly negative this week, our sector equity indices were mixed against a flat market, and we dive into our latest analysis on NKE across the US and globally.
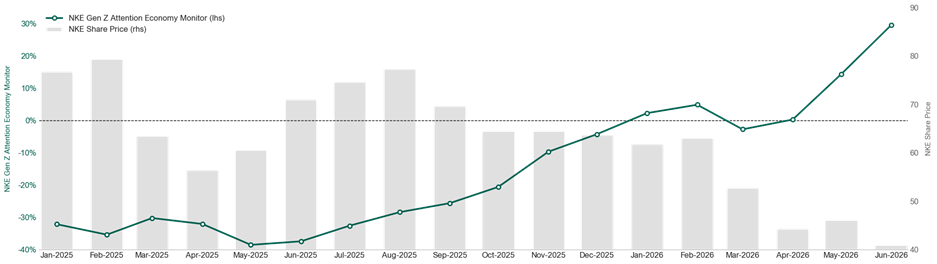
Summary: (1) Optimal’s Sports Ecosystem revenue tracker measured -0.8% T8W y/y, slightly down vs. longer-term trends (-0.1% T16W y/y), with Sports Betting & Data spending accelerating further and remaining the strongest sub-index; (2) Sports equity indices were mixed against a roughly flat market this week, with the Cap-Weighted Ecosystem Index (+1.8% w/w) and Sports Betting & Data Index (+6.4% w/w) sharply outperforming while the Sports Fandom Index (-0.6% w/w) and Sports Participation Index (-1.3% w/w) underperformed; (3) LTH spending and digital traffic are both strongly positive and inflecting positively, while UAA spending and foot traffic are both down and inflecting negatively (digital traffic remained positive y/y but decelerated as well); (4) NKE US digital traffic further accelerated (+12.2% T16W y/y) and Optimal’s Online Monitor reached its highest value since February 2023 (+15.4%), while the Gen Z Attention Economy Monitor accelerated to +29.7% in June.
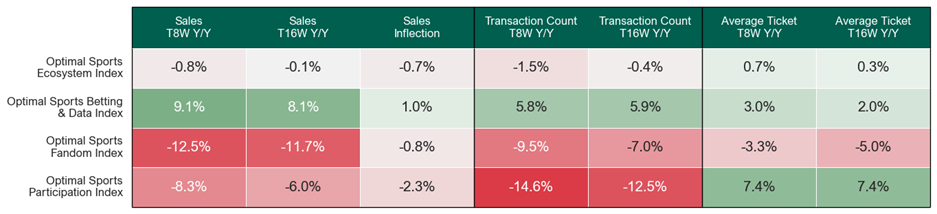
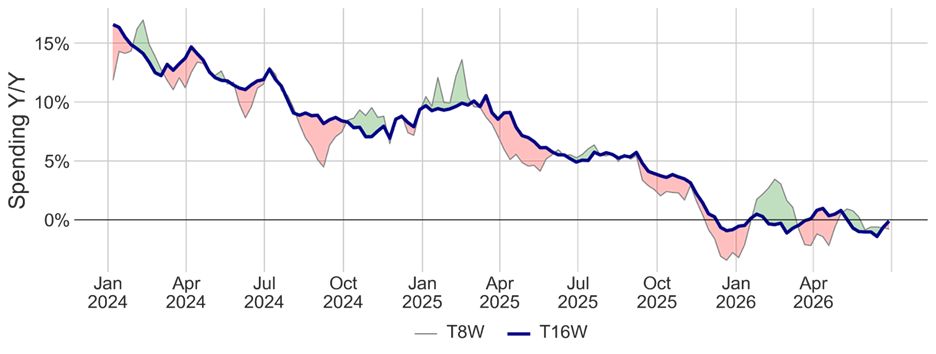
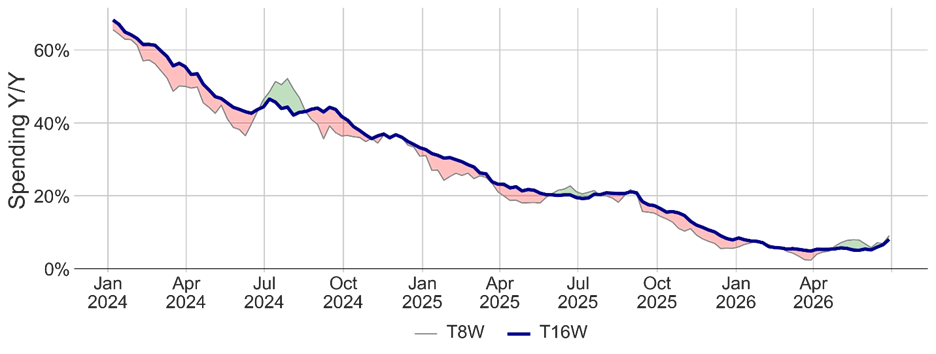
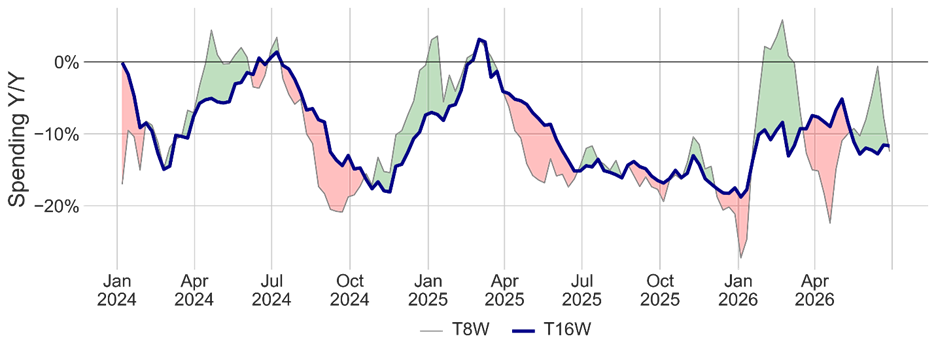
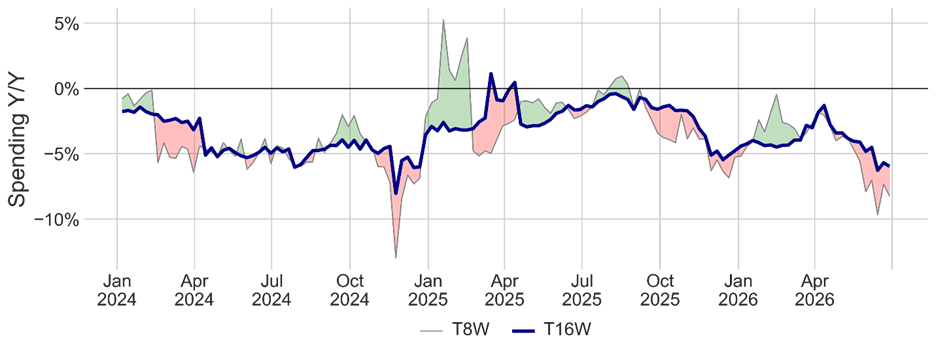
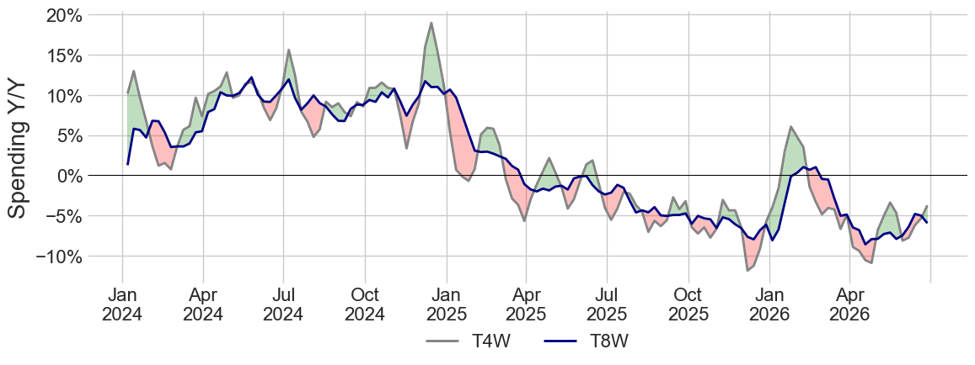
- The Optimal Sports Ecosystem Index revenue tracker was essentially unchanged at -0.8% T8W y/y vs. -0.7% last week (compared to -0.1% T16W). Sports Betting & Data spending accelerated to +9.1% T8W y/y (vs. +8.1% T16W), up from +7.0% last week and remaining the strongest sub-index. Sports Fandom spending decelerated meaningfully to -12.5% T8W y/y (from -7.7% last week) on -9.5% transactions and -3.3% ticket. Sports Participation spending also decelerated to -8.3% T8W y/y (vs. -7.3% last week) on a -14.6% drop in transactions, partially offset by a +7.4% ticket increase. Experiences & Entertainment spending remains sharply down y/y.
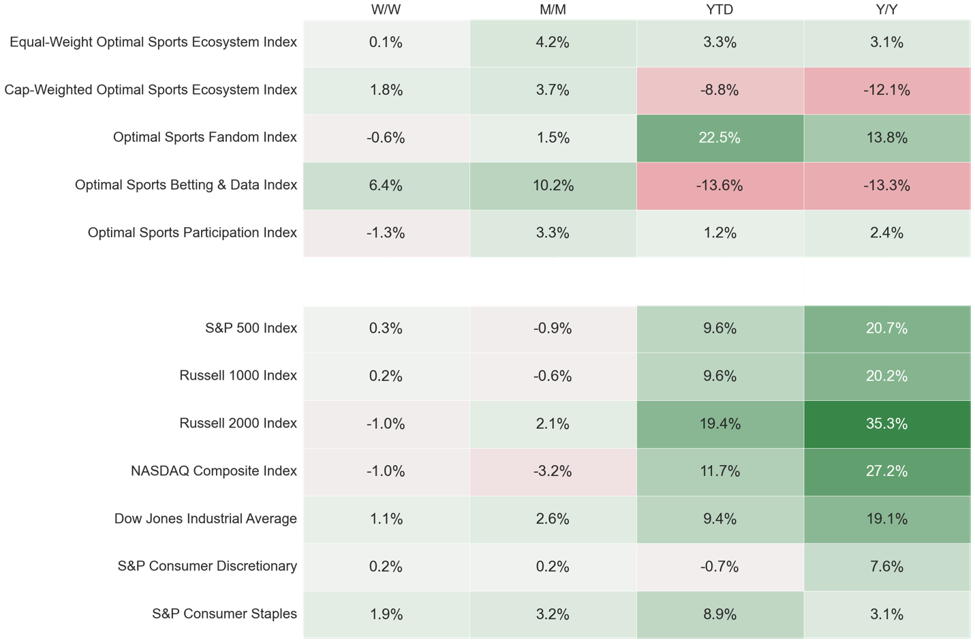
- Sports equity indices were mixed against a roughly flat market this week. The Cap-Weighted Optimal Sports Ecosystem Index (+1.8% w/w) outperformed the S&P 500 (+0.3% w/w), while the Equal-Weight Optimal Sports Ecosystem Index (+0.1% w/w) performed roughly in line. Optimal’s Sports Betting & Data Index (+6.4% w/w) sharply outperformed the broader market and was the strongest sub-index, while the Sports Fandom Index (-0.6% w/w) and Sports Participation Index (-1.3% w/w) both underperformed.
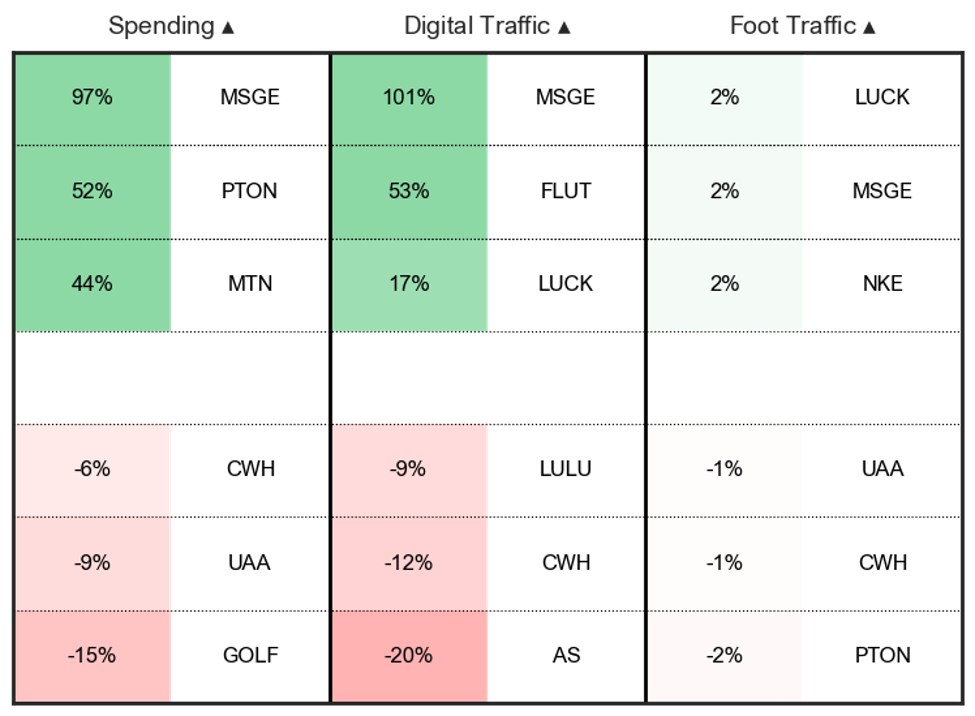
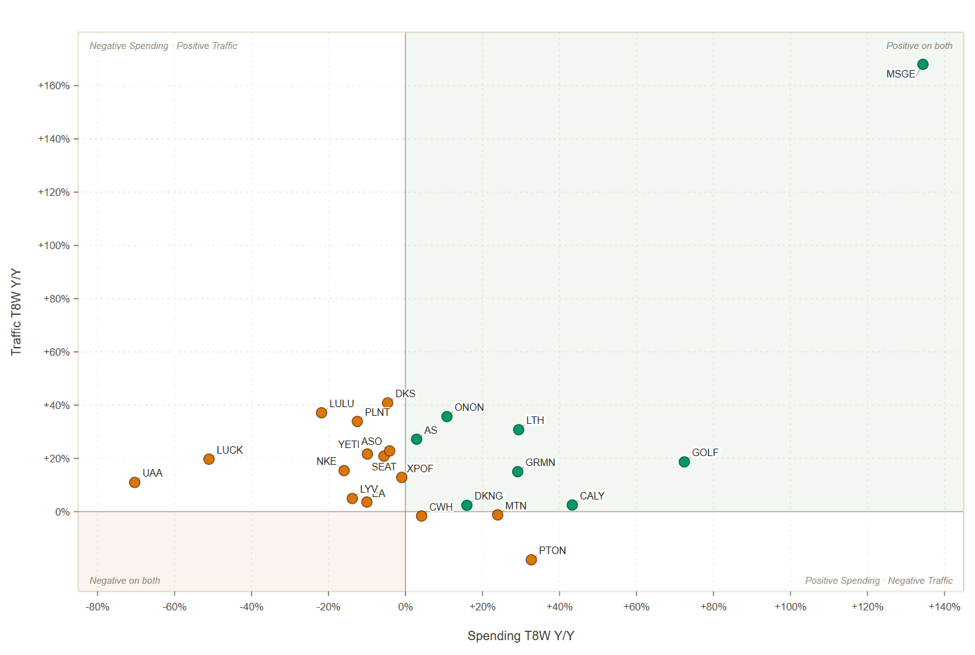
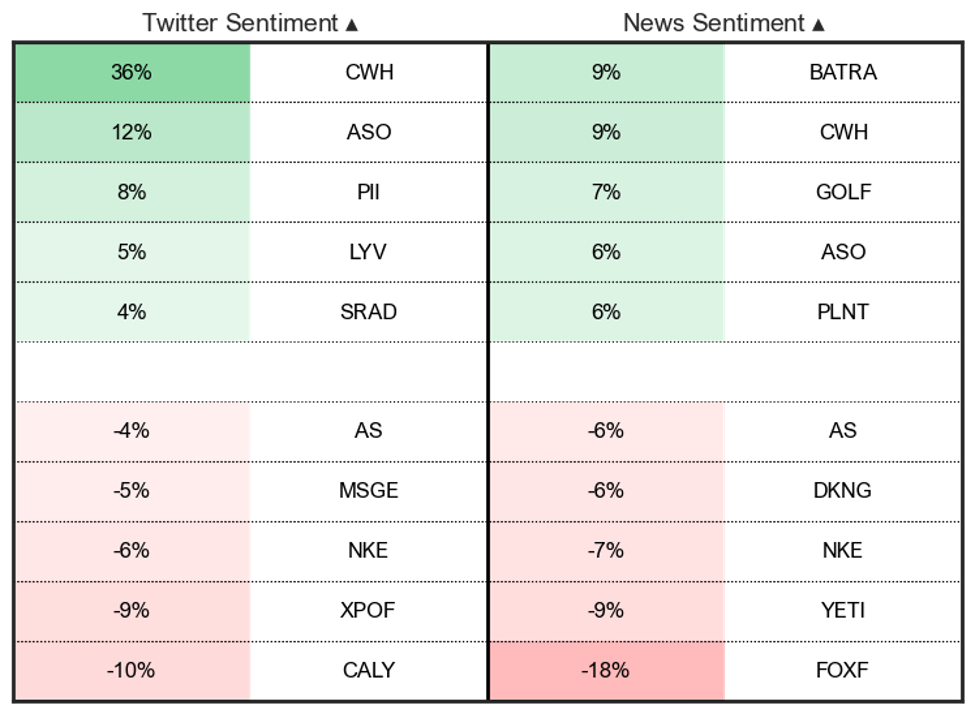
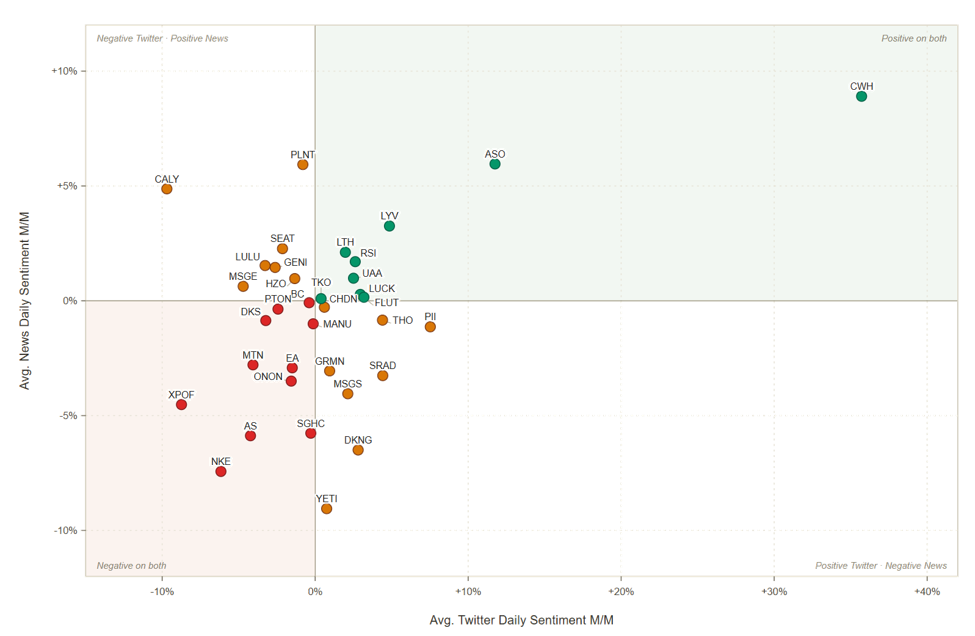
- LTH (+): Spending continues to grow strongly at +29.4% T8W y/y (+6.0% inflection relative to longer-term trend). Digital traffic is also up sharply at +30.8% T8W y/y (+9.2% inflection). Foot traffic has accelerated to flat (0.0% T8W y/y, +1.2% inflection). Twitter sentiment was up +2.0% m/m and news sentiment up +2.1% m/m.
- UAA (–): Spending is down sharply (-70.4% T8W y/y) and inflecting further negatively (-9.4% relative to longer-term trend). Foot traffic is also negative (-5.5% T8W y/y) and inflecting further negatively (-0.8% inflection). Digital traffic growth remains positive in absolute terms (+10.9% T8W y/y) but has decelerated (-2.9%).
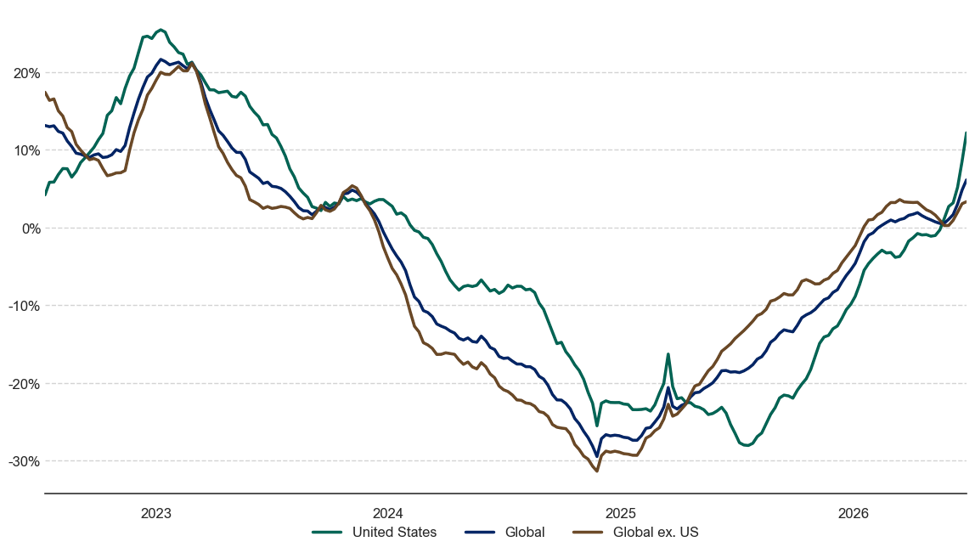
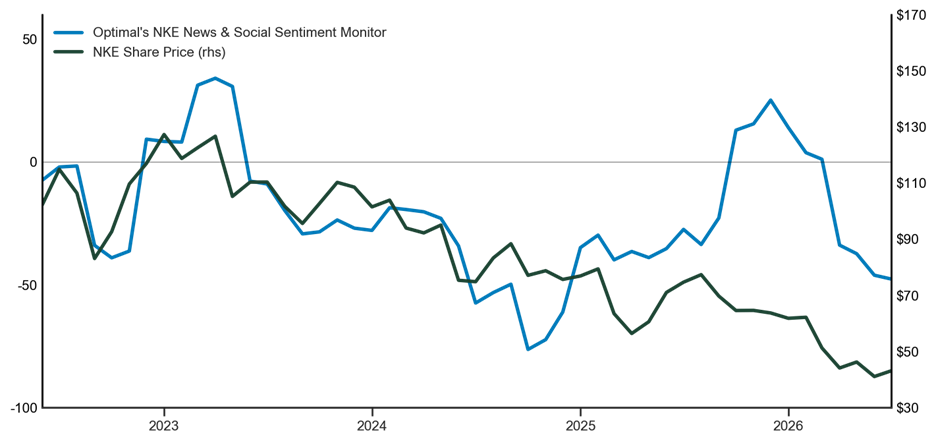
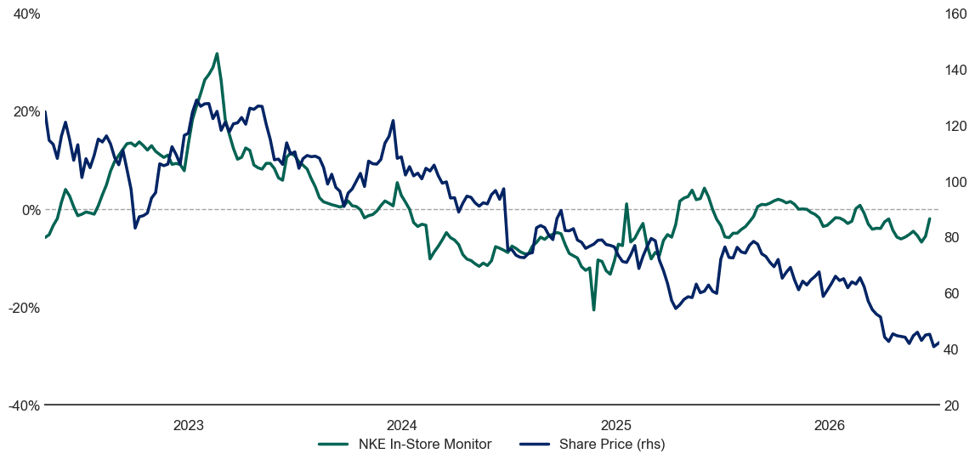
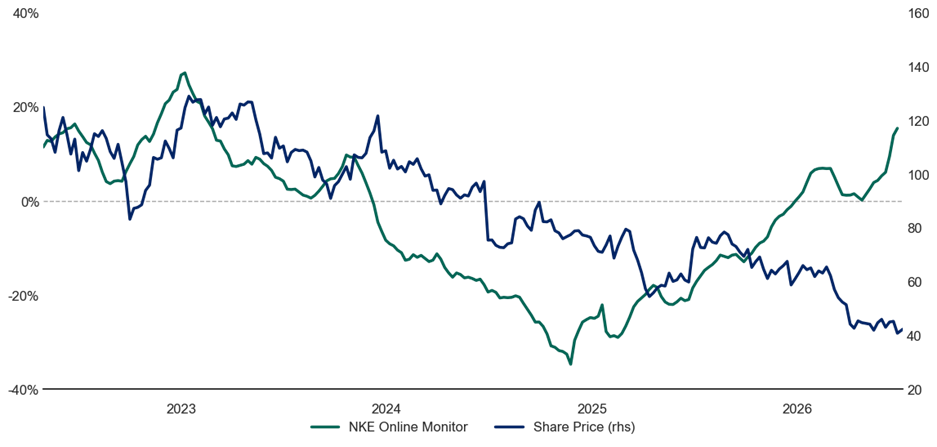
- Weekly NKE Analysis: US digital traffic continued to inflect positively (+12.2% T16W y/y in the most recent week, up from +8.5% last week and -3.7% in mid-March), and global digital traffic continues to accelerate (+6.1% T16W y/y vs. +4.8% last week). Optimal’s Online Monitor accelerated further to +15.4%, its highest value since early 2023, while the In-Store Monitor remains negative at -2.0% but has accelerated from -6.8% two weeks ago. NKE’s Gen Z Attention Economy Monitor accelerated further to +29.7% in June (up from +14.4% in May and +0.3% in April), reflecting sharply improving Gen Z engagement. Monthly sentiment however turned sharply negative following Q4 FY26 earnings, with Twitter sentiment down -6.2% m/m and news sentiment down -7.4% m/m.
Headlines
- Headline: The Big 12 has finalized a multiyear deal with Monster Energy worth around $20M annually to make Monster the entitlement partner of the Big 12’s football and basketball regular seasons, featuring co-branded jersey patches and on-field logos.
- Headline: Rogers Sports & Media is cutting 230 positions and shuttering six radio stations, including Vancouver’s last remaining sports radio station and Calgary’s CFAC-AM.
- Headline: LIV Golf notified its 300-plus global staff of potential corporate layoffs as it seeks new investment for 2027 and beyond, following the Saudi PIF’s announced intention to exit as its main financial backer.
Game of the Week:
- Jannik Sinner vs. Novak Djokovic, Wimbledon Semifinals (July 10th 2026): World No. 1 and defending champion Jannik Sinner (who has not yet dropped a set in the tournament) will face seven-time champion Novak Djokovic in the Wimbledon semifinals for the second straight year after Djokovic won the longest quarterfinal in Wimbledon history, a five-hour-15-minute battle against Felix Auger-Aliassime.
Optimal Sports Ecosystem & Sectors Analysis
Optimal Sports Ecosystem Revenue Trackers
Source: Optimal Advisory Analysis, Bloomberg Second Measure
Optimal Sports Ecosystem Index Revenue Tracker
Source: Optimal Advisory Analysis, Bloomberg Second Measure
Optimal Sports Betting & Data Index Revenue Tracker
Source: Optimal Advisory Analysis, Bloomberg Second Measure
Optimal Sports Fandom Index Revenue Tracker
Source: Optimal Advisory Analysis, Bloomberg Second Measure
Optimal Sports Participation Index Revenue Tracker
Source: Optimal Advisory Analysis, Bloomberg Second Measure
Optimal Sports Entertainment and Experiences Revenue Tracker
Source: Optimal Advisory Analysis, Bloomberg Second Measure
Spending, Digital Traffic, & Foot Traffic Inflections (T8W vs. T16W)
Source: Optimal Advisory Analysis, Bloomberg Second Measure, Similarweb, Placer.ai
Online Traffic vs. Card Spending Growth
Source: Optimal Advisory Analysis, Bloomberg Second Measure, Similarweb
Top Twitter & News Sentiment Monthly Gainers and Declines
Source: Optimal Advisory Analysis, Bloomberg
Twitter Sentiment vs. News Sentiment Monthly Change
Source: Optimal Advisory Analysis, Bloomberg
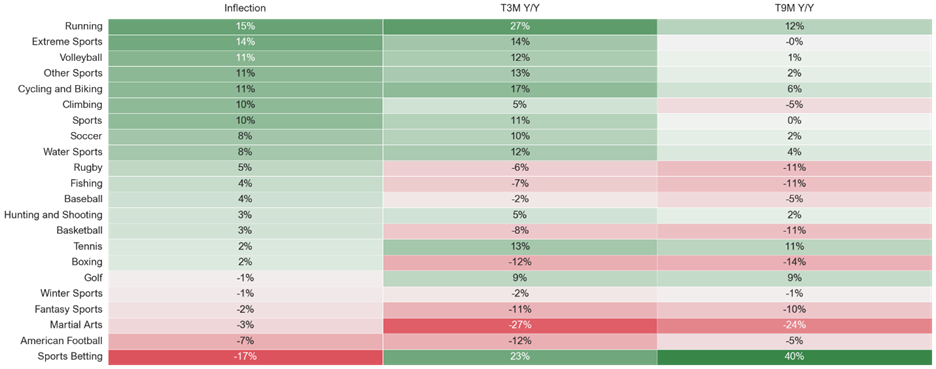
Sports Category Digital Inflections
Source: Optimal Advisory Analysis, Similarweb
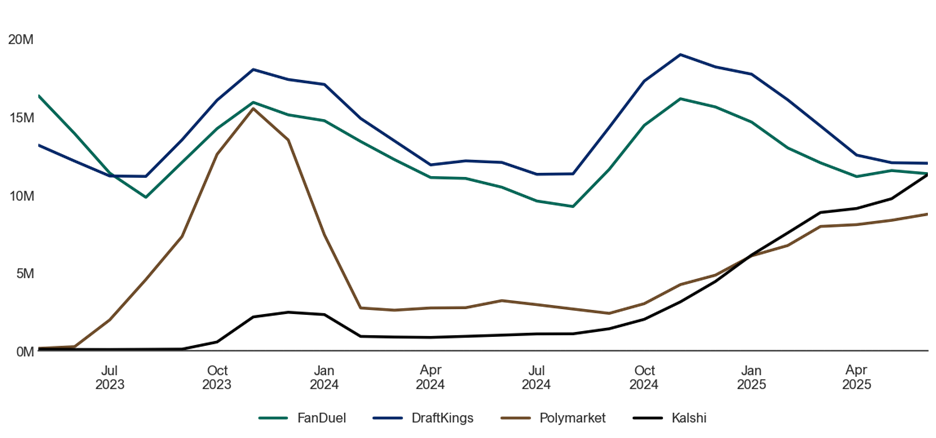
Sports Betting vs. Prediction Market Attention Economy Monitor
Source: Optimal Advisory Analysis, Similarweb
NKE Trends Weekly Analysis
NKE Attention Economy trends continue to accelerate rapidly in the US (+8% y/y T16W) and globally (+5% y/y) following a long period of negative y/y trends.
NKE Global Attention Economy Trends (T16W Y/Y
Source: Optimal Advisory Analysis, Bloomberg, Similarweb
Our Gen Z Attention Economy Monitor, which tracks how Gen Z consumers engage digitally with individual brands, improved for NKE in January (+2% y/y) and February (+5% y/y), declined slightly in March (-3%), and was flat in April, but has increased by +14% y/y in May, signaling greatly improving Gen Z Attention Economy trends. Optimal’s News & Social Sentiment Monitor is lower than late 2025 and has continued to move lower this month but is still higher than late 2024.
Gen Z Attention Economy Monitor
Source: Optimal Advisory Analysis, Similarweb
NKE News & Social Sentiment Monitor
Source: Optimal Advisory Analysis, Bloomberg
Optimal’s In-Store Monitor remains negative y/y but has been mostly stable in recent weeks. Optimal’s Online Monitor continues to accelerate and is now nearing early 2023 peaks.
NKE In-Store Monitor vs. Share Price
Source: Optimal Advisory Analysis, Placer.ai, Bloomberg
NKE Online Monitor vs. Share Price
Source: Optimal Advisory Analysis, Similarweb, Bloomberg
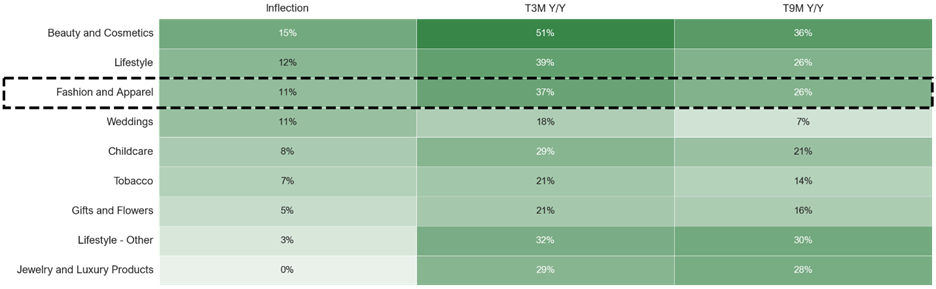
We also note improving online traffic for lifestyle brands broadly and for fashion and apparel brands specifically in May, with traffic both improving and accelerating and inflections also outpacing April numbers (+11% vs. +8%).
Online Traffic to Fashion & Apparel Websites is Improving and Accelerating
Source: Optimal Advisory Analysis, Similarweb
NKE China Analysis
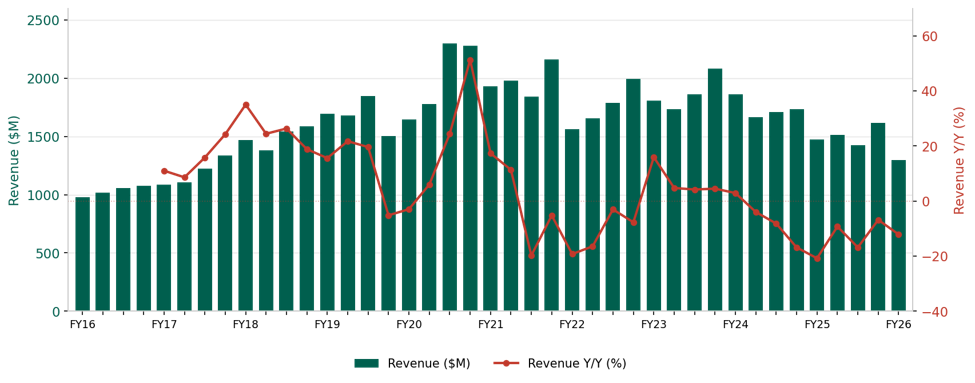
Nike’s Greater China business posted its weakest quarter of FY26 in fiscal Q4 (May-2026), with revenue falling -17% on constant currency (CC) to $1,297M while regional operating income fell to $243M from $304M in the same quarter a year earlier.
NKE China Quarterly Revenue Trend
Source: Optimal Advisory analysis, Bloomberg
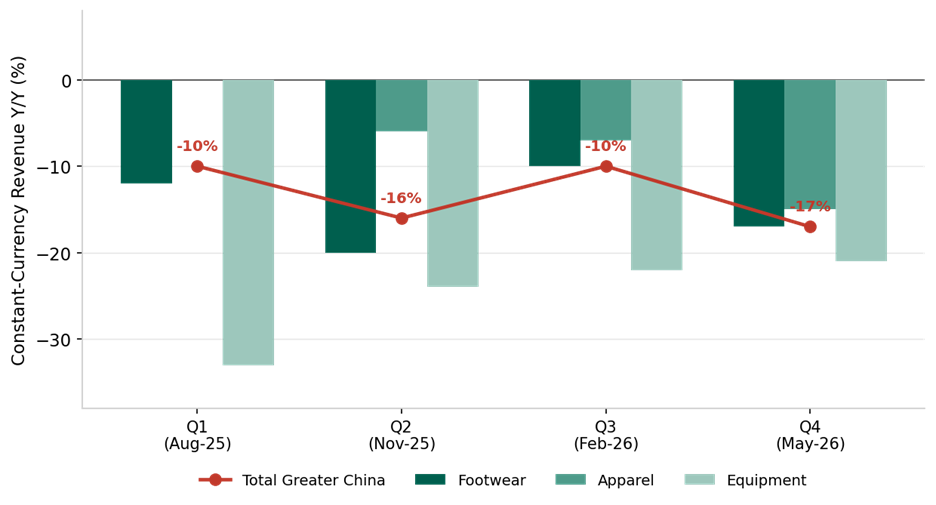
The decline was broad-based across the model’s segment detail: footwear fell to $938M (down -17% CC), apparel to $334M (down -15% CC), and equipment to $25M, with China now having declined year-over-year in every quarter of FY26 (-10% CC in Q1, -16% in Q2, -10% in Q3, -17% in Q4).
NKE China Revenue by Segment
Source: Optimal Advisory analysis, Bloomberg
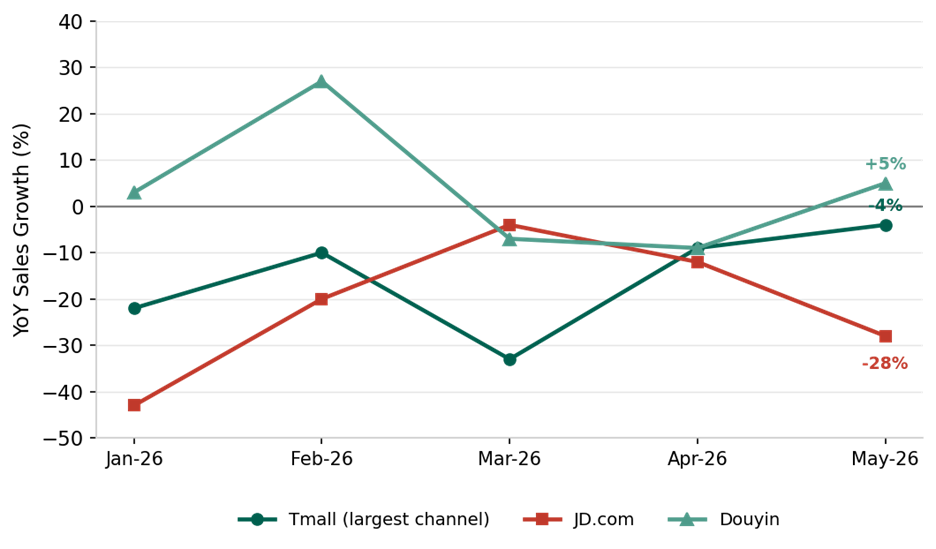
The alternative e-commerce data shows a similar trend. On an aggregate basis, Nike’s China online sales were down -8% y/y in May, following -10% in April and -22% in March, and negative in seven of the last nine months tracked. Nike’s Tmall (its largest platform) was down -4% in May with March down -33%, and JD.com fell -28% in May and has been persistently negative, while Douyin turned modestly positive (+5% in May) as a more positive sign.
NKE China E-Commerce Sales by Channel
Source: Optimal Advisory analysis, Bloomberg
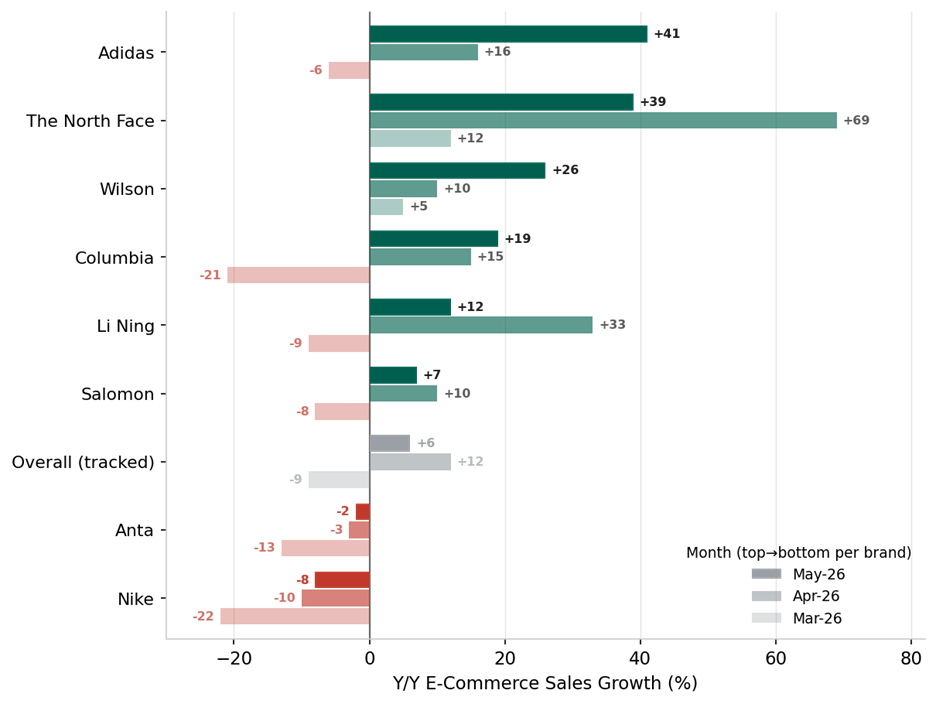
Additionally, domestic and rival brands outgrew Nike, including Adidas (+41%), Li Ning (+12%), The North Face (+39%), Wilson (+26%), and Columbia (+19%), while Nike was one of the few major brands in outright decline. Nike’s Greater China revenue of $1,297M also now trails Adidas’s roughly $1,328M in the region (March quarter), a reversal of Nike’s historical leadership. Management has guided to continued China declines through at least the first half of fiscal 2027, prioritizing inventory cleanup and brand repositioning over near-term sales.
NKE China E-Commerce Sales vs. Competitors
Source: Optimal Advisory analysis, Bloomberg
Equity Performance
Index & Sector Performance
Source: Optimal Advisory Analysis, Bloomberg, prices intraday 7/7/2026
Valuation Snapshots
Optimal Sports Betting & Data Index Components Valuation Snapshot
Source: Optimal Advisory Analysis, Bloomberg
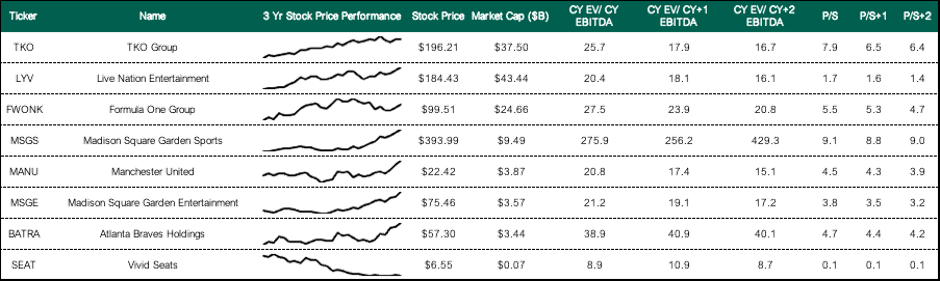
Optimal Sports Fandom Index Components Valuation Snapshot
Source: Optimal Advisory Analysis, Bloomberg
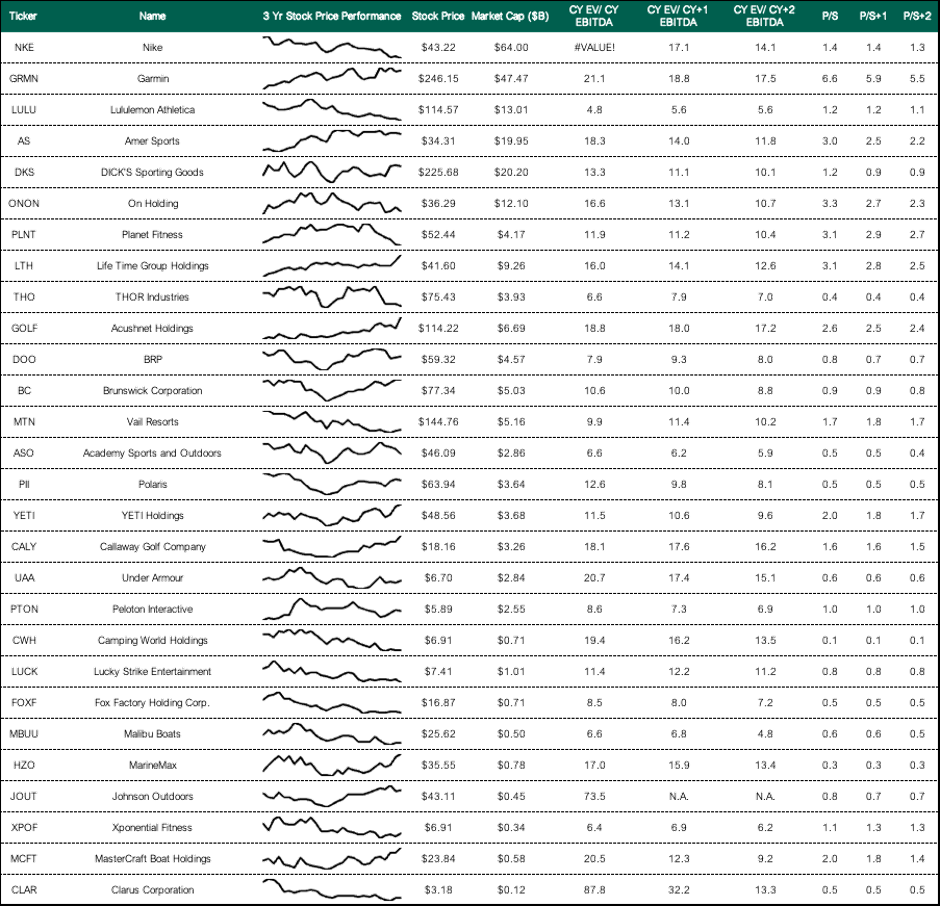
Optimal Sports Participation Index Components Valuation Snapshot
Source: Optimal Advisory Analysis, Bloomberg