Macro Monday: Consumer Deceleration Continued Last Week / Luxury Slowdown Sharpest but Art Robust / Sub-components of Historic Sentiment Decline
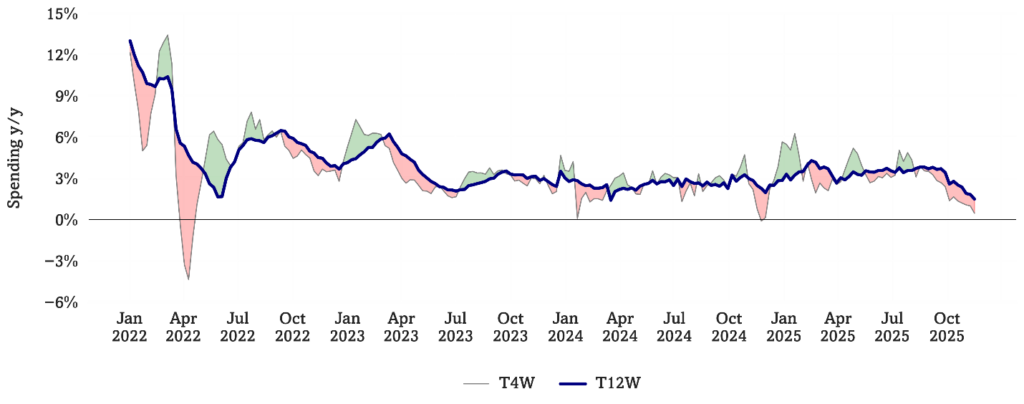
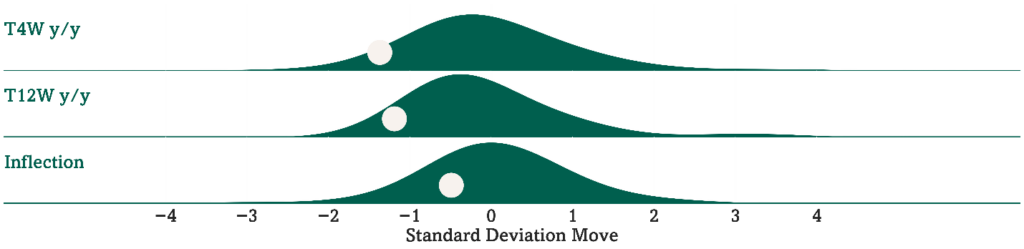
Consumer Velo slowed further last week. Shorter-term spending growth decelerated further last week, now running up +0.4% y/y (now 1.4 standard deviations below average since the start of 2022). Longer-term spending growth is running up +1.5% y/y, leading to a shorter vs. longer-term differential of -1.0% (0.5 standard deviations below average). We note this is the 13th straight week of shorter-term trends running below longer-term trends. See Fig 2-3.
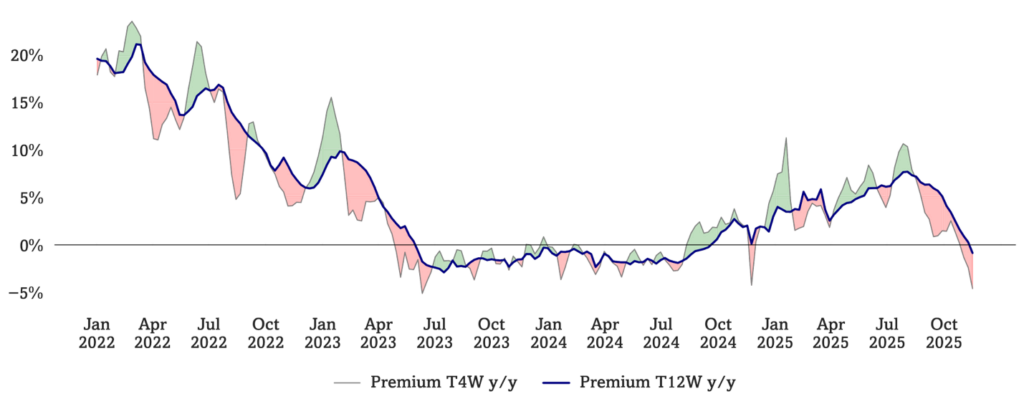
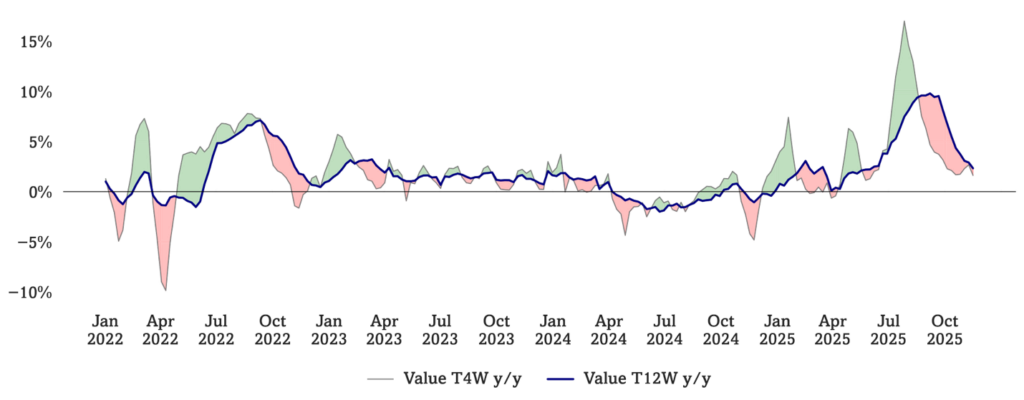
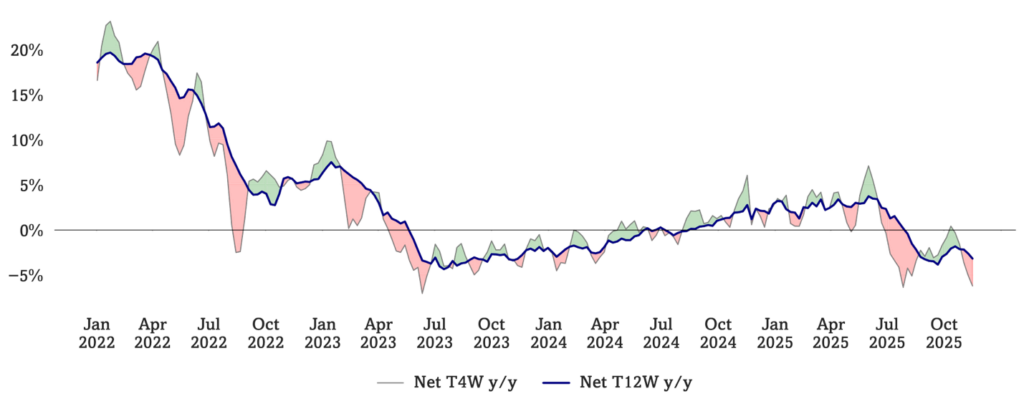
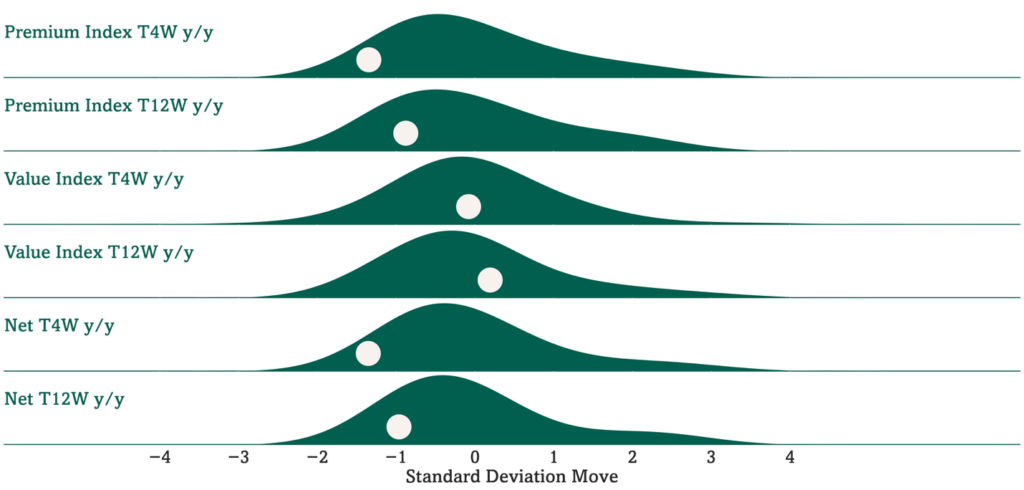
Luxury was softer again last week … our Premium vs Value Monitor continues to show a trend towards Value. We use a combination of consumer spending and psychographic monitoring to monitor Premium and Value traction within consumer activity. Optimal’s Premium Monitor is running down -1.2% y/y on a T4W basis and up +0.2% y/y on a T12W basis, running 380 bp (1.4 standard deviations below average) and 280 bp (1.0 standard deviations below average) respectively below our Value Monitor, which is running up +2.6% y/y on a T4W basis and +3.0% y/y on a T12W basis. This syncs with some of our general economic checks on discretionary lease appetites softening. See Fig 4-7.
Major November art auctions gave a glimpse of a healthy extreme high-end last week. High-profile collections (Klimt, see Fig 1) from high-profile collectors (Lauder, Pritzker) drove $2.2 billion in auction sales versus $1.7 billion estimate. Notably, the depth of bidding broadened to 4-5 participants, breaking a trend of the last 9-12 months with many lots with single bidders. We believe the auction houses did a good job driving discipline of sellers – allowing robust buyer engagement. Buyers from the US and the Middle East were active. Headlines were made with the $236 mm Klimt (with fees), but we note energy in the $2-10 mm price strata as well.
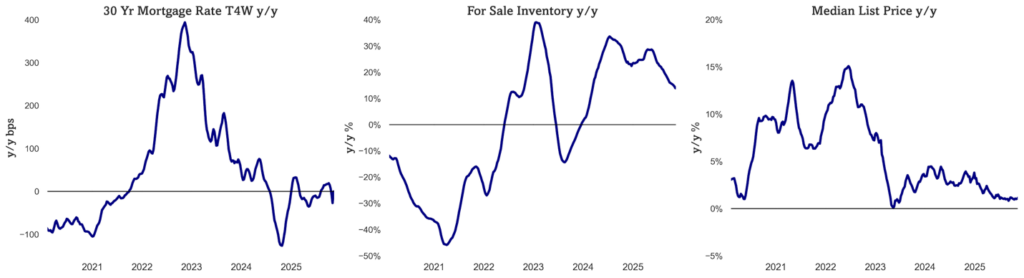
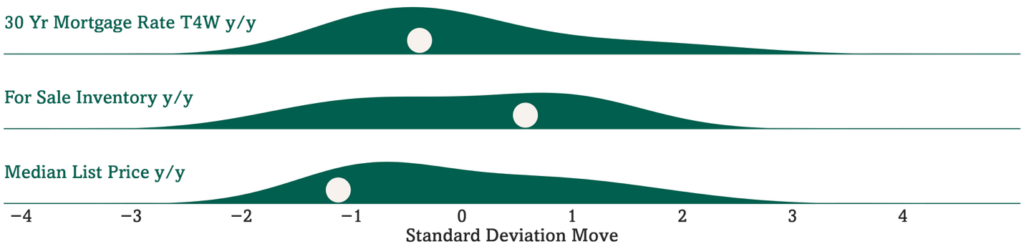
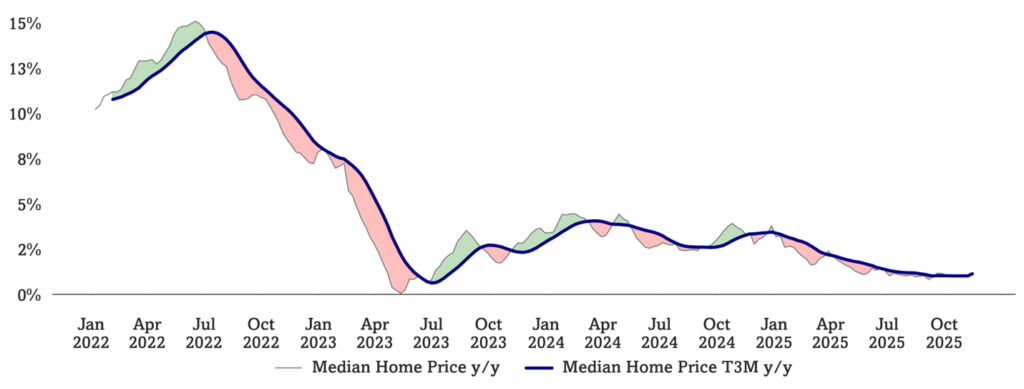
Housing kinetic energy remains net positive as mortgage activity is higher and rates move lower. US 30Y FRM rate is running down -50bps y/y on a T4W basis. MBA’s mortgage applications for purchase is currently running +24% y/y. Inventory available for sale continues to run up +13.9% y/y but has decelerated from +30% y/y in May of this year. Median home prices are running up +1.1% y/y (1.2 standard deviations below average since 2020). Roughly 18% of Americans sell, build, fix, lend to, and furnish homes – velocity matters for the economy. We do also note October foreclosure activity +19% y/y (source: ATTOM) with the highest rates in FL, SC, IL, DE, and NV. See Fig 8-11.
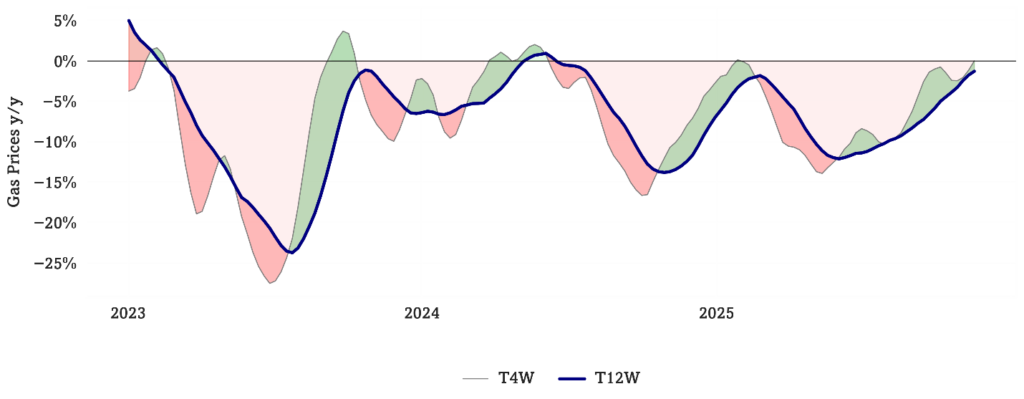
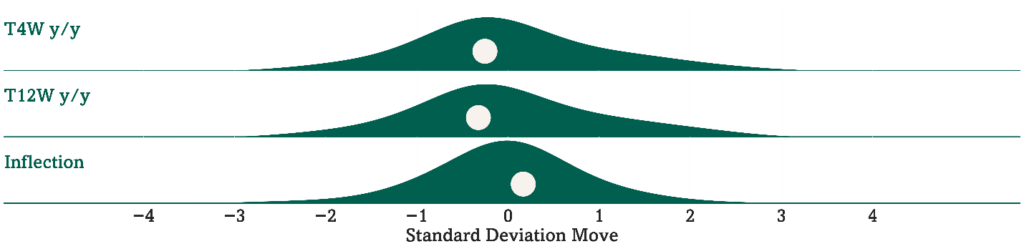
Gas Prices are now running flat y/y on a shorter-term basis, we note erasure of a consumer tailwind for much of 2024-25. Gas prices are flat y/y on a T4W basis and declined -1.3% y/y on a T12W y/y basis, corresponding to a +1.3% inflection between shorter and longer-term trends (0.2 standard deviations above historical trends), the 15th straight week of positive inflections. See Fig 12-13.
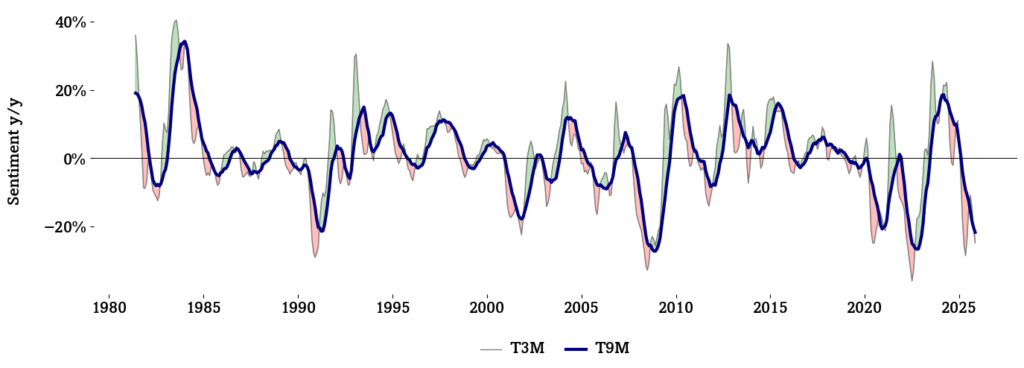
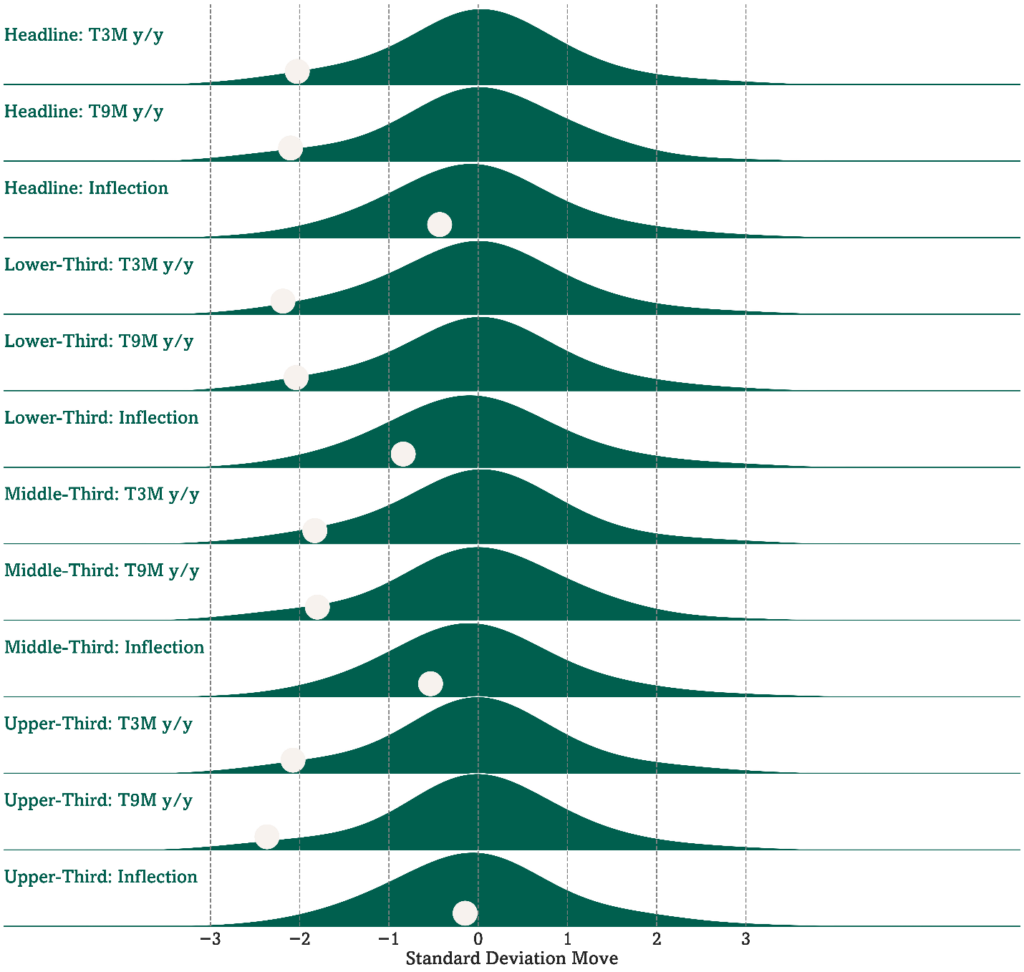
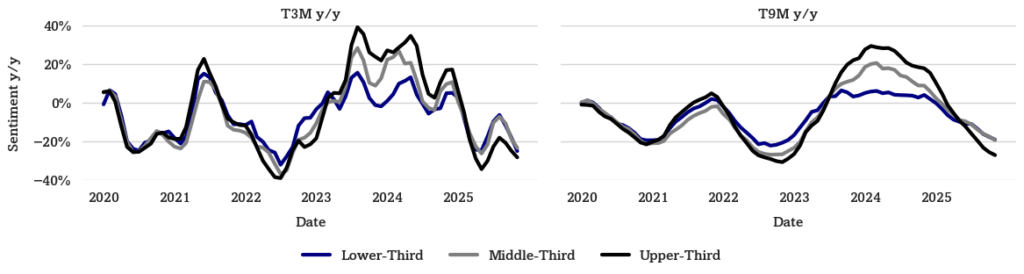
Consumer Sentiment is significantly lower y/y across incomes – just the 4th time this magnitude of y/y pullback has occurred since 1980 and top 1/3 incomes are the sharpest decline. Sentiment has declined -25% y/y on a T3M basis (2.0 standard deviations below average) and -22% y/y on a T9M basis (2.1 standard deviations below average). Upper-income Sentiment has declined -28% y/y on a T3M basis (2.1 standard deviations below average), middle-income Sentiment has declined -24% y/y on a T3M basis (1.8 standard deviations below average), and lower-income Sentiment has declined -25% y/y on a T3M basis (2.2 standard deviations below average). See Fig 14-17.
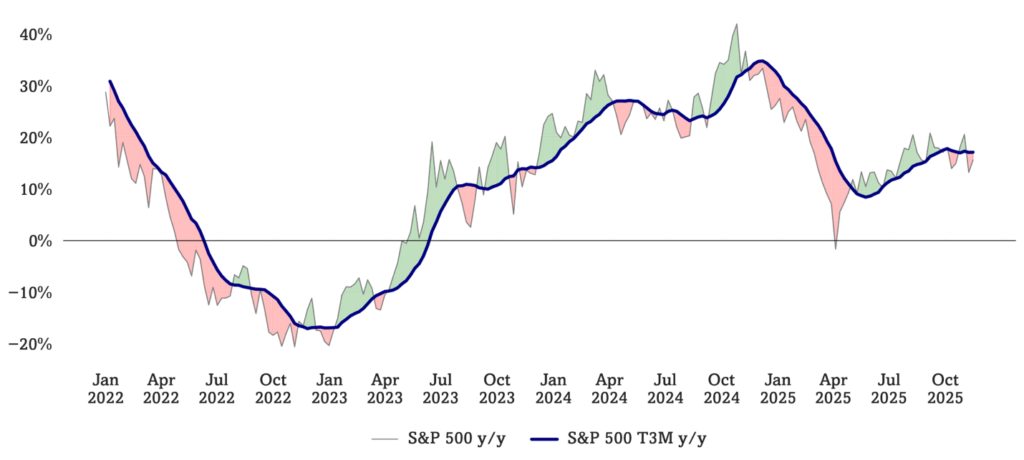
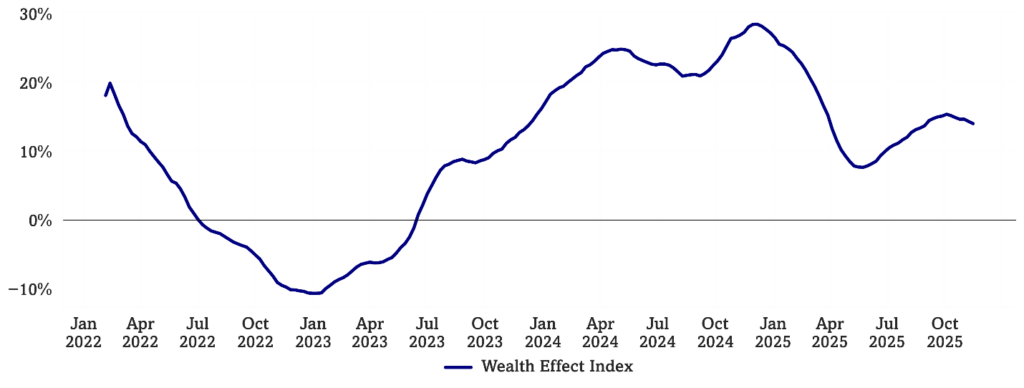
Our consumer Wealth Effect Index trend remains above mean on y/y basis, but the rate-of-change is now measurably slowing. Our Wealth Effect Index is currently at 14.0% y/y (0.3 standard deviations above its mean value since the start of 2022) after peaking at 15.4% in late September. See Fig 18-21.
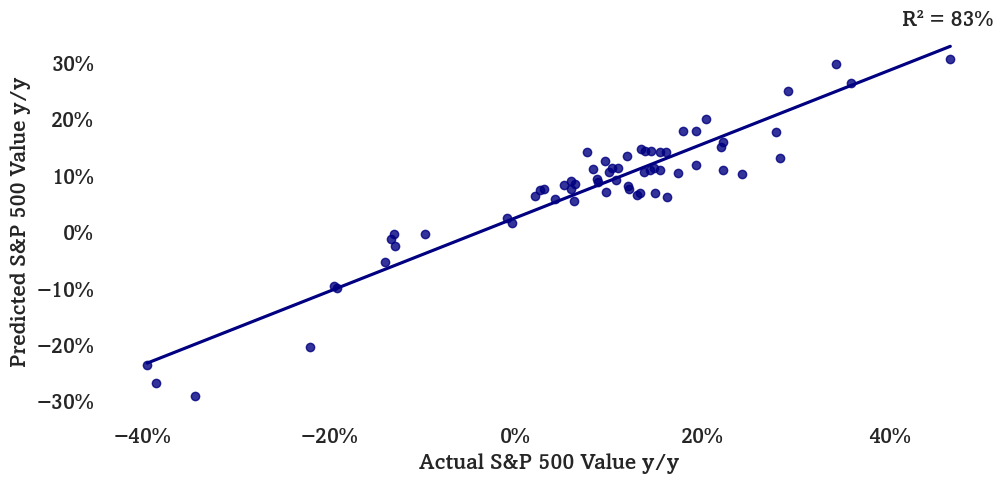
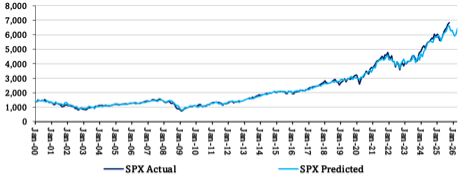
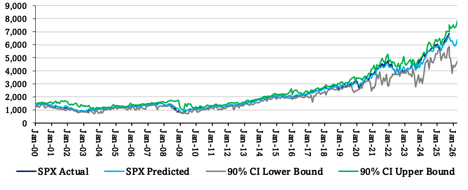
Our Multifactor Macro Market Model suggests downturn potential. Optimal’s Multifactor Macor Market Model projects the S&P 500 as well as bull and bear cases based on lagged data for 12 macroeconomic factors. The model factors suggest softer performance 4Q25 into 1Q26 and stronger performance 2Q26. See Fig 22-24.
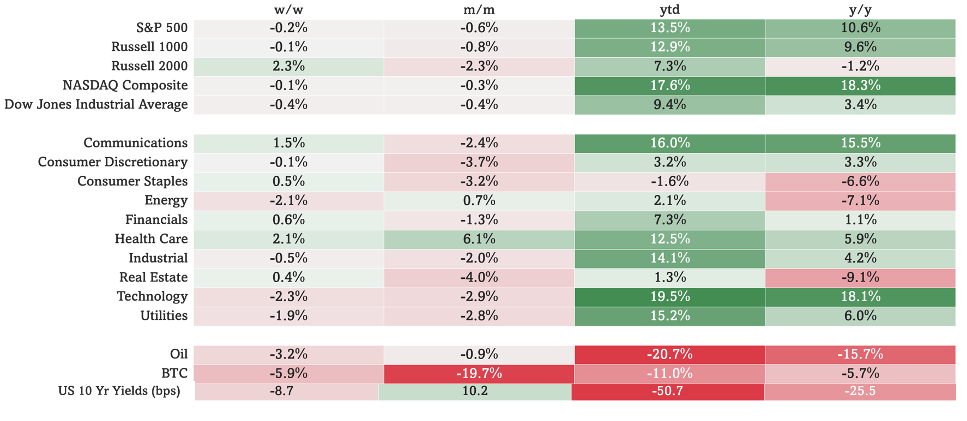
In this weekly note, we focus on key changes in the US consumer’s real-time dynamics. We also highlight “non-normal” current dynamics, relative to historic patterns. See Fig 25 for sector market performance.
Our upcoming virtual client meetings, contact us with questions:
- China and India Markets 2026-2040 (Forces at Work) with Dan Markey senior fellow in China & South Asia programs at Stimson Center prior CFR, Hopkins SAIS, Institute of Peace – Virtual 12/2 Register Here
- Lens on Luxury & Sport – Optimal Conversation with Aston Martin F1 – 12/9 Register Here
- Fine Dining & Hospitality / Luxury that Cares – Virtual Meeting with Jose Andres Group CEO – 12/16 Register Here
Figure 1: Auction Week Highlight – Klimt

Source: Gustav Klimt, Portrait of Elisabeth Lederer, 1914–16, Image courtesy of Sotheby’s
Figures 2-3: Optimal Advisory Consumer Velocity Monitor
Source: Optimal Advisory Analysis, Bloomberg Second Measure
Consumer Spending y/y Relative to Historical Average
Source: Optimal Advisory Analysis, Bloomberg Second Measure
Figures 4-7: Optimal Advisory Premium vs Value Monitor
Source: Optimal Advisory Analysis, Bloomberg Second Measure, Google Trends
Optimal Advisory Premium vs Value Indices Relative to Historical Averages
Source: Optimal Advisory Analysis, Bloomberg Second Measure, Google Trends
Figures 8-11: Housing Kinetic Energy
Source: Optimal Advisory Analysis, Freddie Mac, Zillow, Redfin
Mortgage Rates, For Sale Inventory, & Median List Price y/y Relative to Historical Averages (Since 2020)
Source: Optimal Advisory Analysis, Freddie Mac, Zillow, Redfin
Figures 12-13: Gas Prices y/y
Source: Optimal Advisory Analysis, U.S. Energy Information Administration
Gas Prices y/y Relative to Historical Averages (Since 1992)
Source: Optimal Advisory Analysis, U.S. Energy Information Administration
Figures 14-17: Consumer Sentiment T3M and T9M y/y
Source: Optimal Advisory Analysis, University of Michigan Consumer Survey
Sentiment y/y by Income Tercile Relative to Historical Averages
Source: Optimal Advisory Analysis, University of Michigan Consumer Survey
Comparison of Sentiment y/y Across Income Terciles
Source: Optimal Advisory Analysis, University of Michigan Consumer Survey
Figures 18-21: Wealth Effect Index & Components
Source: Optimal Advisory Analysis, Bloomberg, Zillow, Redfin
Median Home Price y/y, S&P 500 y/y, & Wealth Effect Index (Since 2022)
Source: Optimal Advisory Analysis, Bloomberg, Zillow, Redfin
Figures 22-24: Optimal Advisory Multifactor Macro Market Model
Historical Test Predictions vs. Actual (On Test Data Only)
Sources: Optimal Advisory Proprietary Analysis, Bloomberg, FRED, BLS, BEA, OECD, University of Michigan Consumer Sentiment Survey, U.S. Census Bureau, FRB
Actual & Projected S&P 500 (Including Training & Test Data)
Sources: Optimal Advisory Proprietary Analysis, Bloomberg, FRED, BLS, BEA, OECD, University of Michigan Consumer Sentiment Survey, U.S. Census Bureau, FRB
Actual & Projected S&P 500 with Confidence Intervals
Sources: Optimal Advisory Proprietary Analysis, Bloomberg, FRED, BLS, BEA, OECD, University of Michigan Consumer Sentiment Survey, U.S. Census Bureau, FRB
Figure 25: Weekly Index & Sector Performance
Source: Optimal Advisory Analysis, Bloomberg, prices intraday 11/24/2025