More Conflict = Costs Higher. Inputs +0.6 w/w, +4.3% y/y; Cocoa & Coffee Ease, Grains Surge. HSY+, Wing Restaurants+, CPB-, EPC-. Optimal Cost Factor
The Optimal Advisory Cost Factor accelerated on a y/y basis for the second week in a row. For the year, costs are up (+4.3% y/y) primarily on energy and packaging. Deflationary softs & sweeteners have bounced recently while inflationary energy/packaging inputs again surge.
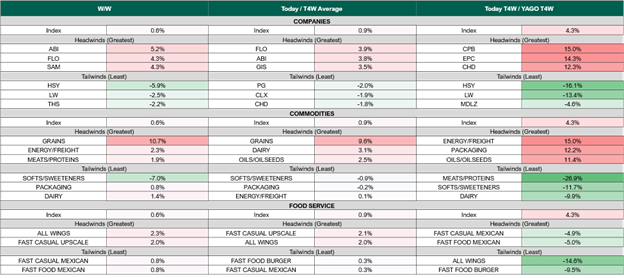
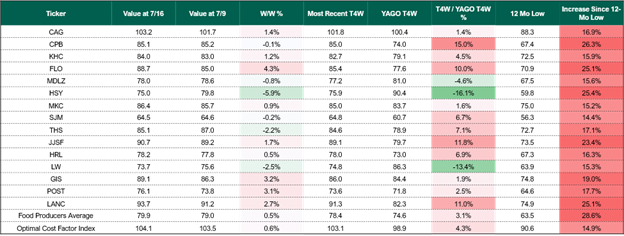
Cost tailwinds to watch: Meats/Proteins -26.9%, Softs/Sweeteners down -11.7% y/y, HSY -16.1% y/y, Softs/Sweeteners -7.0% w/w See Fig 1.
Cost headwinds to watch: Energy/Freight +15.0% y/y, Packaging +12.2% y/y, CPB +15.0% y/y, EPC +14.3% y/y, Grains +10.7% w/w. See Fig 1.
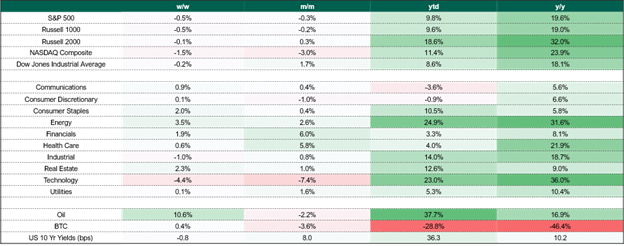
Higher energy costs & shipping risk are implicitly an immediate tax on everything: Within COGS, they drive the cost of packaging (esp. aluminum), inbound & outbound freight as well as farm level costs (diesel, fertilizer) that are key to plantings, supply & future food inputs. Within SG&A, they drive delivery costs. They also threaten revenue with more consumer budget constraints. We monitor weekly performance of key equity indices and macro indicators. See Fig 11.
After bottoming 2 weeks ago, Crude back up +20% as US launches new strikes on Iran and Hormuz traffic slows. WTI rose again above approaching $80 a barrel, now up roughly 17% y/y, albeit down from +$100/barrel seen at the recent peak. Shipping traffic and oil volumes are likely to be disrupted again just as prices were moderating.
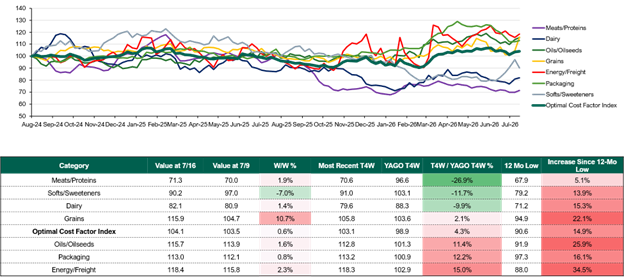
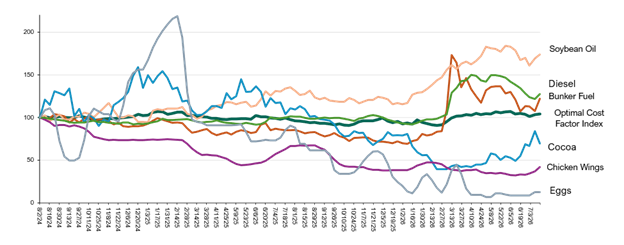
Cost Factor +0.6% w/w, +4.3% y/y (vs. prior week flat +2.1 w/w & +3.6% y/y). Notable commodity moves this week include Coffee & Cocoa both down double digits w/w on crop outlooks. Grains including Wheat, Barley, Oats were all up double digits as tensions rise in the Black Sea between Ukraine and Russia (key cereal grain sources). Diesel & Bunker Fuel jumped on Hormuz traffic disruptions.
In this weekly note, we identify spot input costs’ putative impact on the U.S. fast moving consumer goods (FMCG) value chain, most measurably impacting staples, staples retailers, restaurants & food service. Optimal’s proprietary cost factor weights ticker & sector specific cost trends using a proprietary formula based on 32 trackable spot cost inputs – 23 of which are updated as of last night, the other 9 are latest available.
Figure 1: Weekly Cost Factor Summary
Sources: Optimal Advisory Proprietary Analysis, Bloomberg, FRED, USDA, BEA
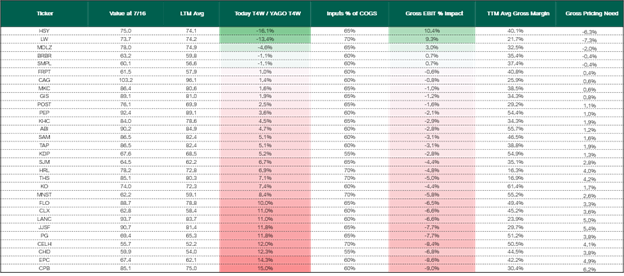
Figure 2: Weekly Cost Factor Margin Context
Sources: Optimal Advisory Proprietary Analysis, Bloomberg, FRED, USDA, BEA
Figure 3: Weekly Input Commodity Performance by Group
Sources: Optimal Advisory Proprietary Analysis, Bloomberg, FRED, USDA, BEA
Figure 4: Biggest Input Cost Movers y/y
Sources: Optimal Advisory Proprietary Analysis, Bloomberg, FRED, USDA, BEA
Figure 5: Food Sector Cost Factor
Sources: Optimal Advisory Proprietary Analysis, Bloomberg, FRED, USDA, BEA
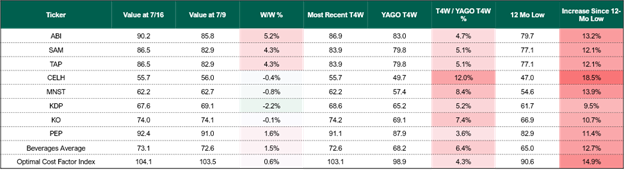
Figure 6: Beverage Sector Cost Factor
Sources: Optimal Advisory Proprietary Analysis, Bloomberg, FRED, USDA, BEA
Figure 7: HPC Sector Cost Factor

Sources: Optimal Advisory Proprietary Analysis, Bloomberg, FRED, USDA, BEA
Figure 8: Restaurant Level Cost Factor

Sources: Optimal Advisory Proprietary Analysis, Bloomberg, FRED, USDA, BEA
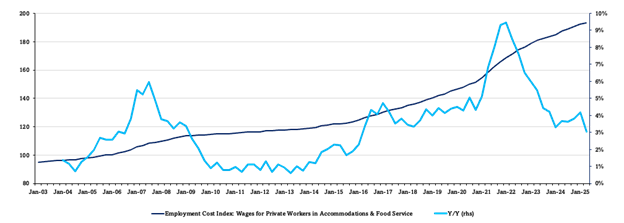
Figure 9: Restaurant Employment Cost Index
Sources: Optimal Advisory Proprietary Analysis, Bloomberg, FRED, USDA, BEA
Figure 10: Staples Sector Theme Box
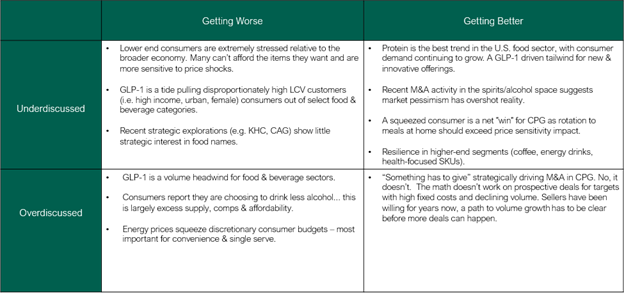
Figure 11: Market Sector Performance
Sources: Optimal Advisory Proprietary Analysis, Bloomberg