Oh Good, Cyclospora (80% Jump in Consumer Concern + Names & Precedents); Consumer Velocity Decelerates; Wealth Effect Slide: Macro Monday (on Sunday)
Summary: (1) Cyclospora is just beginning to drive income questions on restaurant, produce, and the food supply chain, in Chart of the Week we measure the level of concerns and discuss names and precedents; (2) Our math shows Consumer Velocity decelerated last week, see Fig 1; (3) Mortgage applications fell as borrowing costs remain elevated, with the 30Y FRM at 6.49% (last below 6% in Fall 2022), see Fig 3-6; (4) Gas prices in flux as middle east volatility picks up again, but sticky gas inflation remains the dominant macro signal at +36% y/y T4W, see Fig 7; (5) Sentiment moved higher m/m after hitting all-time lows (44.8) last month; we note lower-income and higher-income Sentiment with very different sequential moves, see Fig 9-12; and (6) the Wealth Effect Index decelerated for the fourth straight week, see Fig 13-16.
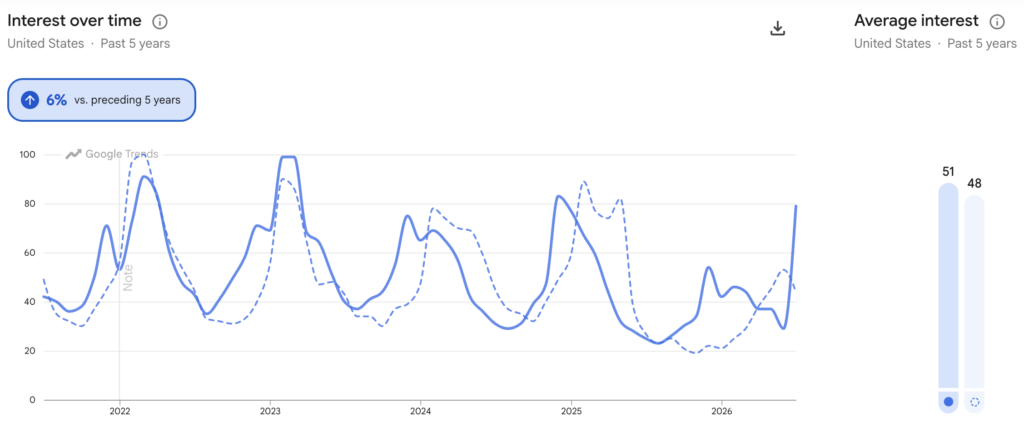
Chart of the Week: Spike in Concern from Consumers on “Stomach Virus“
Food-borne illness concerns are running 80% higher than this time last year. There is clear seasonality to such occurrences (generally in winter) so the slope of concern is the most compelling point here – there are essentially no other spikes in such searches while the seasonal average comparison falls). CMG in 2015-2016 and JACK in 1993 had linked impacts to business and share price as consumers changed behaviors. WEN in 2022 had a linked outbreak, but very limited impact as it was contained. As of the writing of this note there have been no statements from players in the space, other than CMG stating it is “monitoring the situation”. Optimal’s Jonathan Feeney also notes this “could result in additional costs and lost product mix for food service distributors (SYY, USFD, PFG, and select fresh produce players (FDP, DOLE).
Source: Optimal Advisory Analysis,
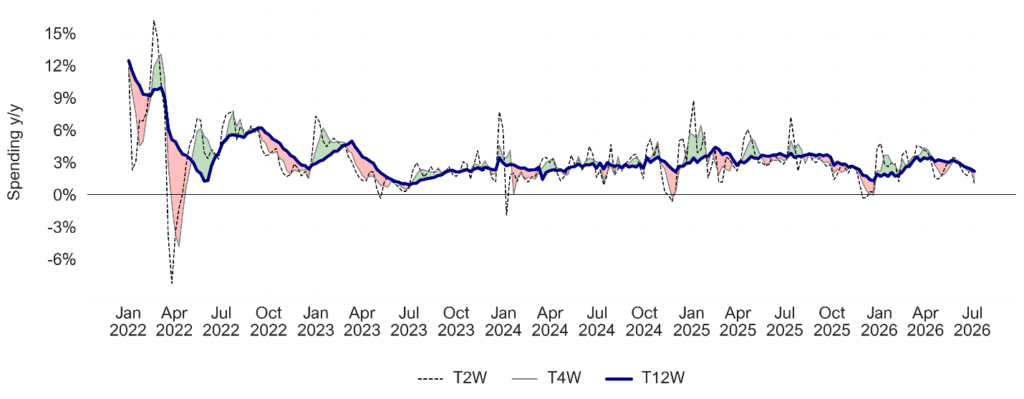
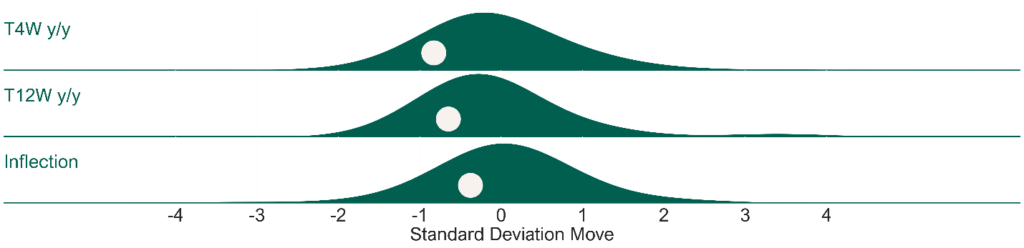
Our Consumer Velocity tracker decelerated this week, with the T4W at +1.4% y/y (from revised +2.2% the prior week) and the T12W at +2.2% y/y (from +2.4%). The underlying trend remains slightly softer than average at 0.8 standard deviations below the post-2022 average on a T4W basis and 0.6 standard deviations below average on a T12W basis. See Fig 1-2.
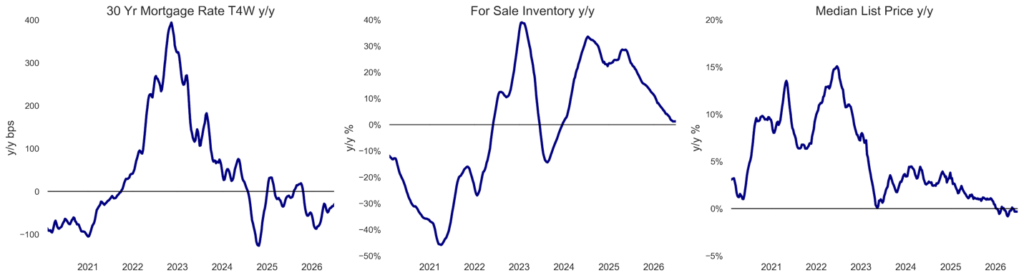
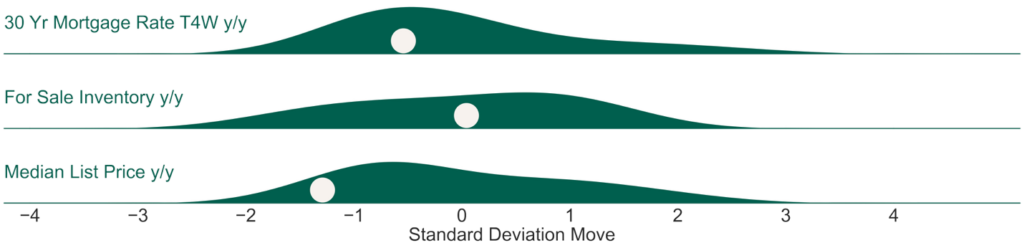
Housing borrowing costs remain elevated; leading housing indicators down. US 30Y FRM rate is up to 6.49%, running down -28 bps y/y on a T4W basis (0.2 standard deviations below average since 2020). MBA’s mortgage applications for purchase index is running down -7% y/y while refinance applications index is flat y/y. Median home prices are slightly down y/y. Roughly 18% of US GDP is related to the selling, building, fixing, lending to, and furnishing of homes – velocity matters for the economy. See Fig 3-6.
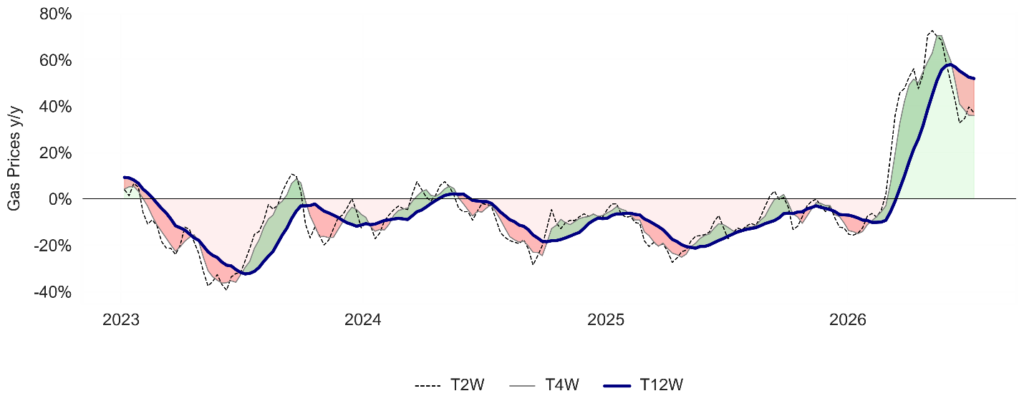
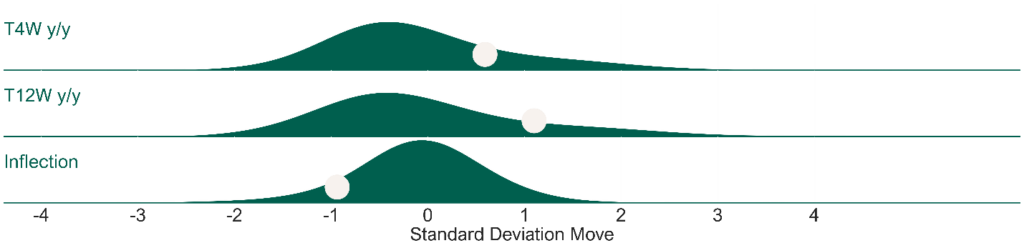
Gasoline inflation largely remained stable this week after several weeks of sharp deceleration, with the weekly print easing to +36% y/y (decelerating from +38%), the T4W stable at +36% y/y, and the T12W stable at +52% y/y. The T4W trend is 0.6 standard deviations above average, and the T4W vs. T12W inflection narrowed slightly to −16.0 pts (from −16.5), though shorter-term growth remains well below the longer-term trend. We continue to flag that utilities (electricity and heating fuel) run about 9% of lower-income household spending vs. 4% for higher-income households, compounding the squeeze at the bottom of the income distribution. See Fig 7-8.
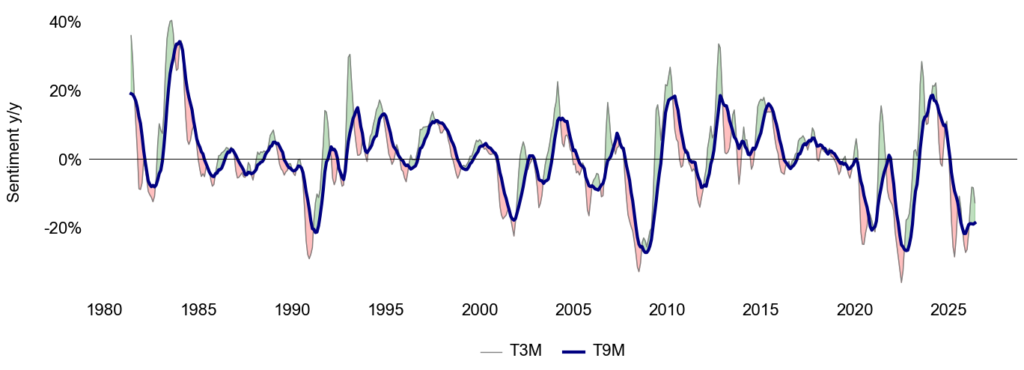
Sentiment increased off last month’s all-time low (44.8) to 49.5, but it remains the second-lowest reading on record, with headline Sentiment y/y decelerating to -18% this month (from -14%). Overall, headline Sentiment is down -18% y/y this month and -13% on a T3M basis (1.0 standard deviations below average) and -19% y/y on a T9M basis (1.8 standard deviations below average). Upper-third income Sentiment is down -6% y/y on a T3M basis (0.5 standard deviations below average), decelerating from -1% y/y T3M last month. Middle-income Sentiment is down -17% y/y on a T3M basis (1.3 standard deviations below average), decelerating from -11% y/y T3M last month, and lower-income Sentiment is -19% y/y on a T3M basis (1.6 standard deviations below average), decelerating from -15% last month, although lower-income Sentiment is up +26% m/m. See Fig 9-12.
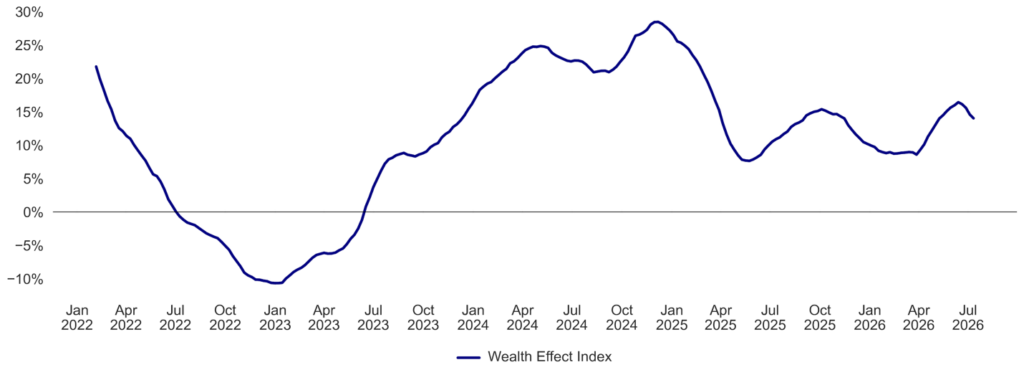
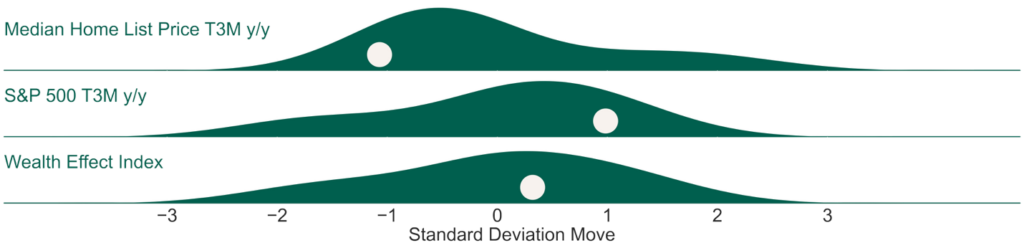
Consumer “Wealth Effect” continued to decelerate this week. Optimal Advisory’s Wealth Effect Index is at +14.0% y/y (decelerating from +14.6% y/y last week and 0.3 standard deviations above average since the start of 2022). With home prices slightly negative y/y and despite headwinds from lower crypto prices we note the “flywheel” of wealth effect remains elevated off strong equity returns. See Fig 13-16.
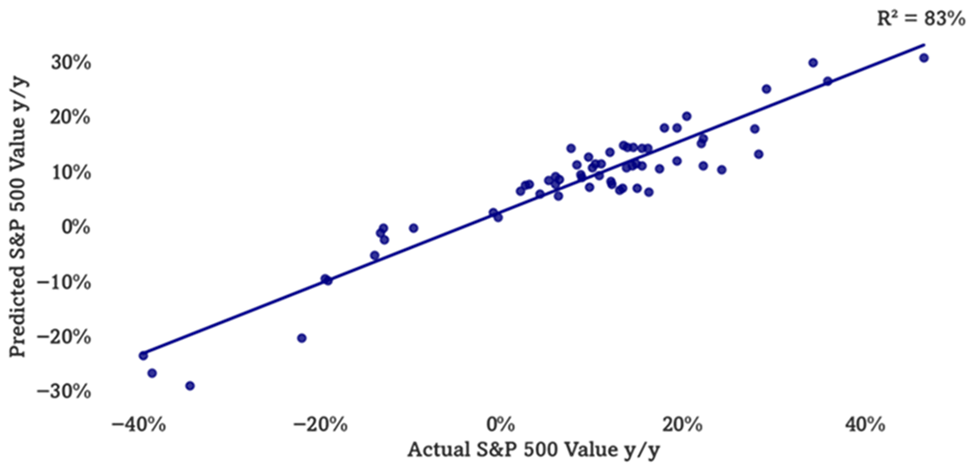
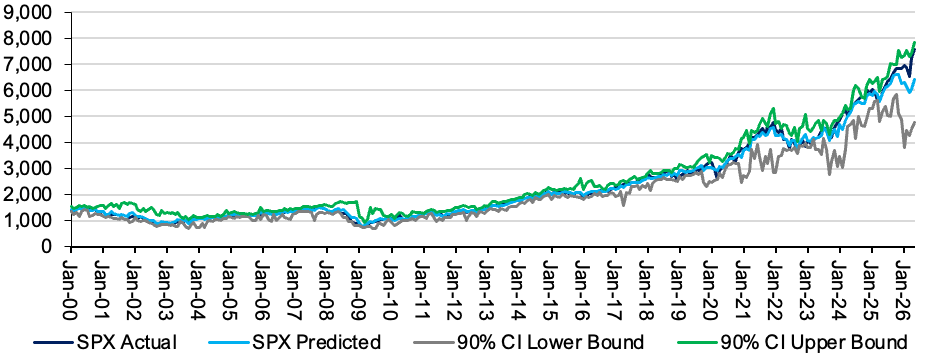
Our Multifactor Macro Market Model had been suggestive of March 2026 softness, rebound. Optimal’s Multifactor Macro Market Model projects the S&P 500 as well as bull and bear cases based on lagged data for 12 macroeconomic factors. The model suggested the S&P 500 to fall to just below 6000 by March, before rebounding back up to 6400 by May. We use this model as a guide to how macro would guide the market, given our analysis of current variables. This is, of course, outside of other factors at work. See Fig 17-18.
Figures 1-2: Optimal Advisory Consumer Velocity Monitor
Source: Optimal Advisory Analysis, Bloomberg Second Measure
Consumer Spending y/y Relative to Historical Average
Source: Optimal Advisory Analysis, Bloomberg Second Measure
Figures 3-6: Housing Kinetic Energy
Source: Optimal Advisory Analysis, Freddie Mac, Zillow, Redfin
Mortgage Rates, For Sale Inventory, & Median List Price y/y Relative to Historical Averages (Since 2020)
Source: Optimal Advisory Analysis, Freddie Mac, Zillow, Redfin
Figures 7-8: Gas Prices y/y
Source: Optimal Advisory Analysis, Bloomberg
Gas Prices y/y Relative to Historical Averages (Since 1992)
Source: Optimal Advisory Analysis, Bloomberg
Figures 9-12: Consumer Sentiment T3M and T9M y/y
Sentiment y/y by Income Tercile
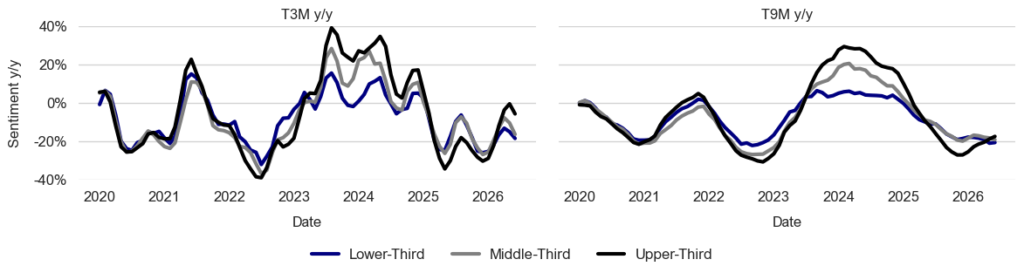
Comparison of Sentiment y/y Across Income Terciles
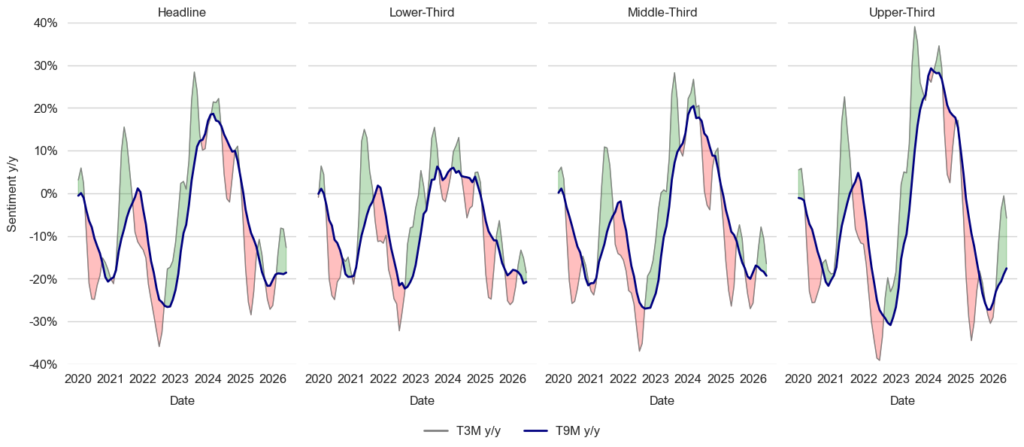
Source: Optimal Advisory Analysis, University of Michigan Consumer Survey
Figures 13-16: Consumer Wealth Effect & Components y/y
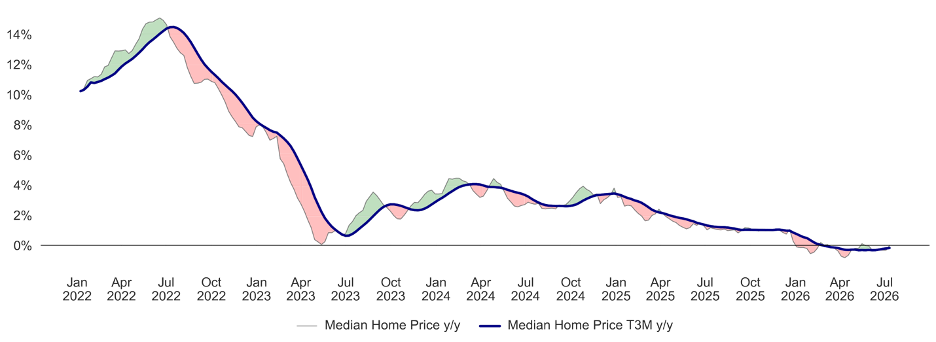
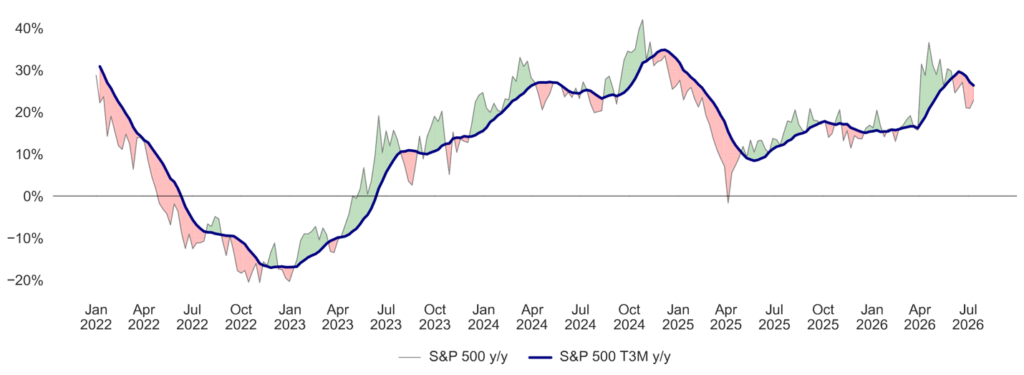
Source: Optimal Advisory Analysis, Bloomberg, Zillow, Redfin
Median Home Price y/y, S&P 500 y/y, & Wealth Effect Index (Since 2022)
Source: Optimal Advisory Analysis, Bloomberg, Zillow, Redfin
Figures 17-18: Optimal Advisory Multifactor Macro Market Model
Historical Test Predictions vs. Actual (On Test Data Only)
Source: Optimal Advisory Proprietary Analysis, Bloomberg, FRED, BLS, BEA, OECD, University of Michigan Consumer Sentiment Survey, U.S. Census Bureau, FRB
Actual & Projected S&P 500 (Including Training & Test Data) with Confidence Intervals
Source: Optimal Advisory Proprietary Analysis, Bloomberg, FRED, BLS, BEA, OECD, University of Michigan Consumer Sentiment Survey, U.S. Census Bureau, FRB
Figure 19: Index & Sector Performance
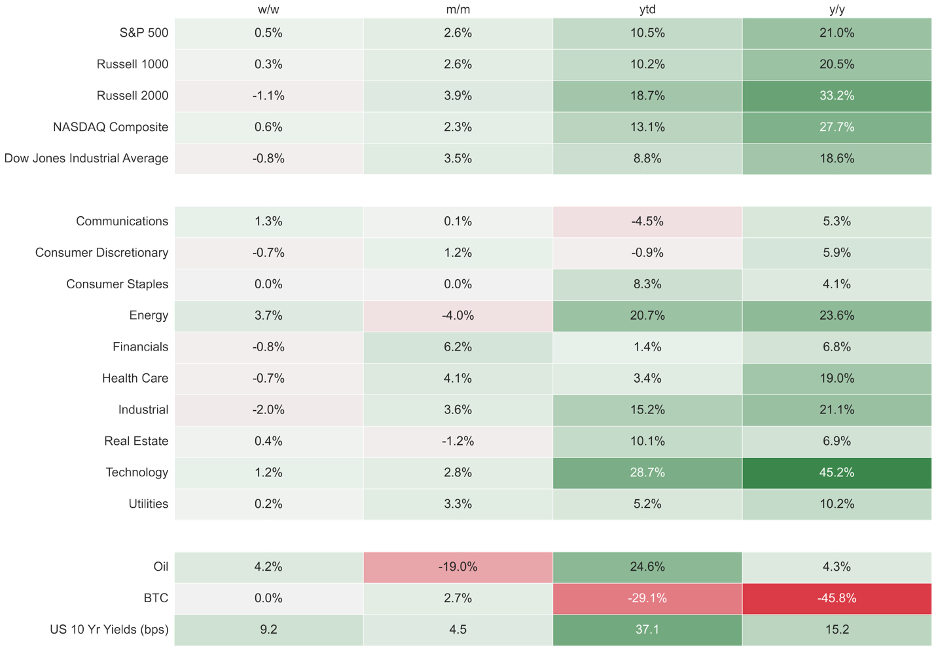
Source: Optimal Advisory Analysis, Bloomberg, prices at market close 7/10/2026