Our 3 Keys to MSFT EPS: Capex Impact on FCF, Azure Capacity, and Copilot Monetization
Our 3 Keys to MSFT EPS: Capex Impact on FCF, Azure Capacity, and Copilot Monetization
Optimal’s 3 keys for MSFT EPS: (1) capex revisions to 2026 & 2027 capex vs. sequential Q2 FCF change; (2) Azure revenue growth of 39–40%, with management reaffirming the promised second-half acceleration; (3) proof that the shift to user-plus-usage pricing is showing up in Microsoft 365 Commercial cloud and GitHub revenue, beyond seat counts.
We see MSFT trend and tone sounding like GOOG: cloud grew 82% y/y, but a raised capex forecast and its first ever negative free cash flow gave investors pause. There has been no indication that hyperscalers are improving FCF relative to capex. But we firmly believe that MSFT is still for most Fortune 2000 CIOs the default purchase for deep, tech integration, and this is a discipline issue, not a long-run market penetration issue.
1). Capex: How much higher for 2026 and the first real look at FY27.
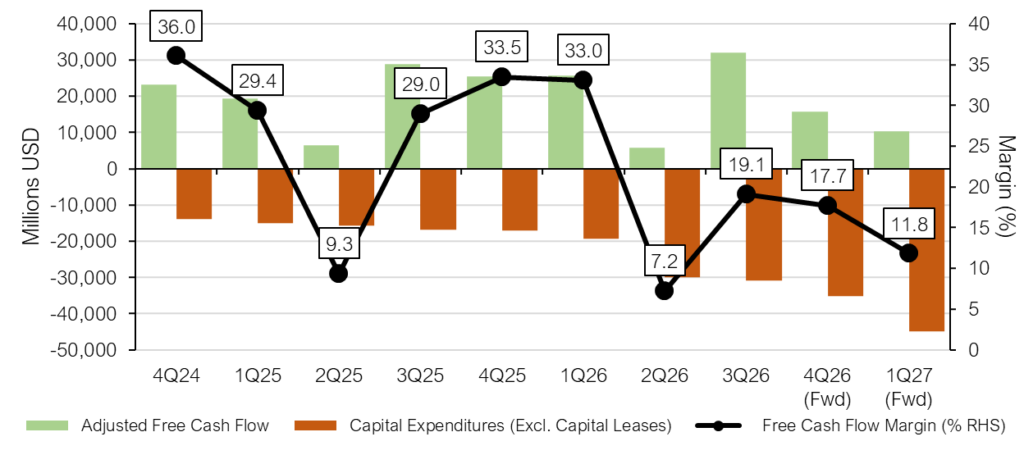
We’re watching whether the $190bn holds and whether management gives any real framing for FY27. We’re expecting that like Google, MSFT will revise its capex forecast upward for 2027 and FCF will be worse in Q4 than Q3. The worst outcome on the call would be a further capex increase with no corresponding lift in Azure growth or RPO.
Q3 free cash flow (GAAP) came in at $15.8bn, down from $20.3bn a year earlier despite operating cash flow rising 26%. Depreciation and amortization reached $10.2bn, up 16% versus 18% revenue growth, reflecting six-year server depreciation schedules. Q4 guidance implies operating margin slipping to roughly 44% from 46.3%, with Microsoft Cloud gross margin holding near 64%.
Incremental profit from Azure, Microsoft 365 and security needs to outpace four new cost buckets: depreciation on servers and data centers, the power to run them, the compute burned every time an agent answers a query, and a fleet that costs more per unit because of memory prices. If write-offs keep growing faster than revenue, the top line can look strong while profit barely moves.
Figure: Capex Accelerating
Source: Optimal Advisory analysis, Bloomberg
2). Azure and the promised second-half acceleration
Q3 Azure grew 40% (39% in constant currency), ahead of the 37–38% guide, and Q4 is guided to 39–40%. Management has said demand exceeds supply across workloads, customer segments and regions, that constraints persist at least through calendar 2026, and, most importantly, that Azure growth should accelerate modestly in the second half of the calendar year.
We care about the composition, not just the headline: AI services versus core infrastructure, consumption running above contractual commitments, and how much of any beat reflects capacity coming online early versus demand actually improving. Reassuring would be Q4 printing at the high end with the acceleration language repeated for FY27. Concerning would be an in-line quarter paired with softer language on that second-half call. Google Cloud’s 82% growth has reset the bar for what a leading hyperscaler print looks like.
3). Copilot: watch ARPU and usage intensity, not just seat growth.
Microsoft 365 Copilot passed 20m paid seats, up 250% year-over-year with 5m net adds in the quarter, though that’s still only about 4% of a commercial seat base above 450m. Management guided net adds higher again for Q4, and that should show up in ARPU within Microsoft 365 Commercial cloud, guided to 15–16% growth in constant currency on an adjusted basis and helped by the July price increases.
We’d rather see depth than distribution: queries per user (up about 20% sequentially), first-party agent monthly actives (up six-fold year to date), Copilot Credit consumption (up nearly 2x quarter-over-quarter), and how concentrated the seat count is in a handful of large commitments. Accenture alone accounts for over 740,000 seats.
Figure: Copilot seat growth is outrunning penetration of the installed base
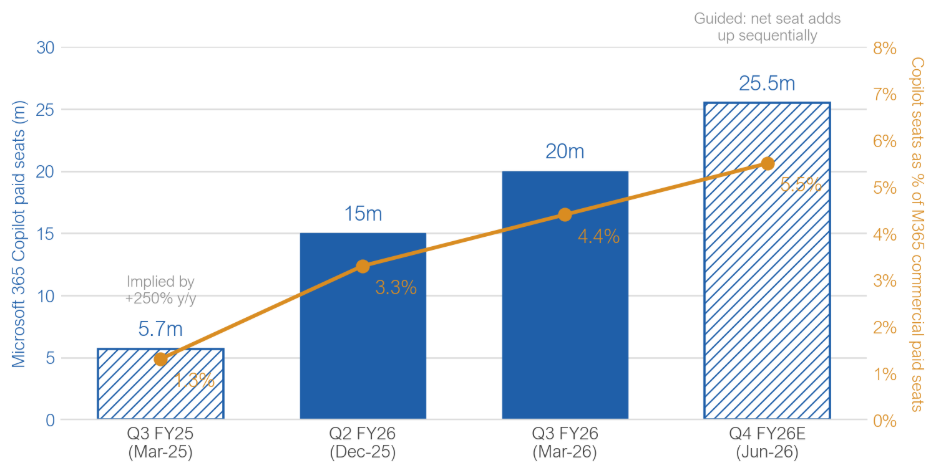
Solid bars = disclosed by MSFT. Hatched = implied/guided. M365 commercial paid seat base >450m, +6% y/y
Source: Optimal Advisory analysis, Microsoft earnings releases and calls. Q3 FY25 seats implied from disclosed growth rate; Q4 FY26 estimated.
GitHub Copilot moved to usage-based pricing on June 1, so Q4 only captures a single month of new pricing. Nearly 60% of Dynamics service customers already buy usage-based credits, and Dynamics bookings softened as customers straddled the two pricing models. Management has said that consumption revenue will increasingly skip bookings and go straight to billed revenue.
That makes bookings an increasingly unreliable proxy for demand, and it puts pressure on management to quantify consumption directly. Without that disclosure, the gap between a $627bn backlog and reported revenue growth gets harder to justify. Also worth watching: what usage-based GitHub pricing does to Intelligent Cloud gross margin, which management has already flagged as a drag.