Restaurant Costs Easing, Natural Gas Plummets, Input Costs Down -3.5% w/w, -2.7% y/y. Friday Cost Factor
Optimal Advisory Cost Factor – Input costs down w/w off energy moves, with natural gas declines helping all manufacturers. Cocoa has jumped ~10% off the bottom but still the most notable input tailwind. Input declines alongside easing labor costs are helping the restaurant profit outlook, especially wings.
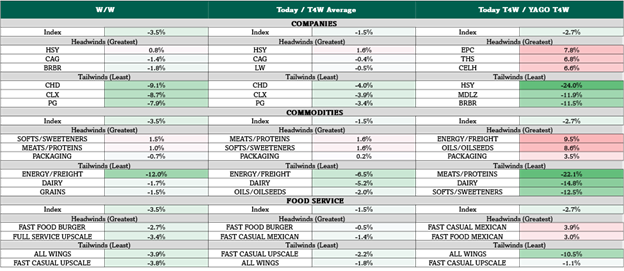
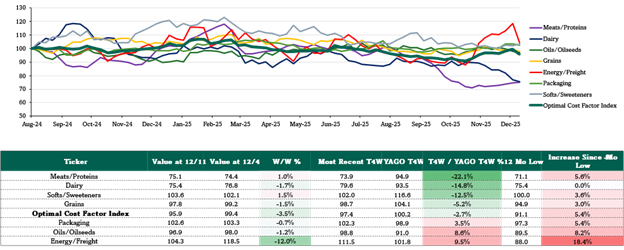
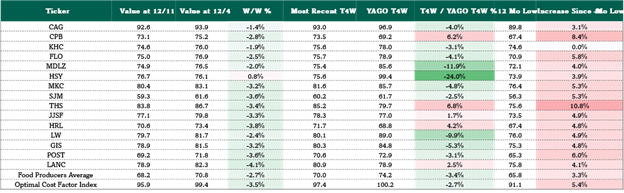
Cost Factor -3.5% w/w, -2.7% y/y (vs. prior week +0.8% w/w & -1.9% y/y). We note interesting reversals this week from the largest longer-term commodity headwinds and tailwinds. Energy/freight with significant w/w declines despite leading measured commodity categories. Meanwhile cocoa, one of the largest cost tailwinds, moved higher this week after bottoming the week of 11/20. See Figs 1-8.
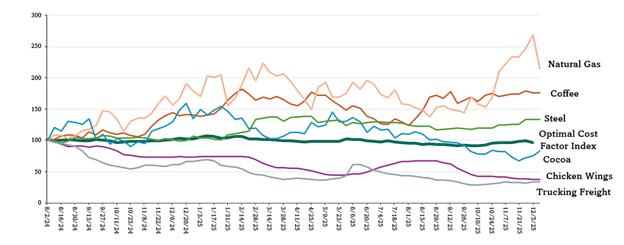
Energy costs down on forecasts for a milder second half of the month. After hitting a three-year high last week, natural gas prices are down -20% w/w (from $5.29 USD/MMBtu to $4.23 USD/MMBtu) with implications for most stocks and companies in coverage. HPC companies (CHD, CLX, PG) the greatest beneficiaries of the weekly drop. Virtually every major input cost (e.g. factories, freight, packaging) outside the food chain is tied to energy. See Figs 4-7.
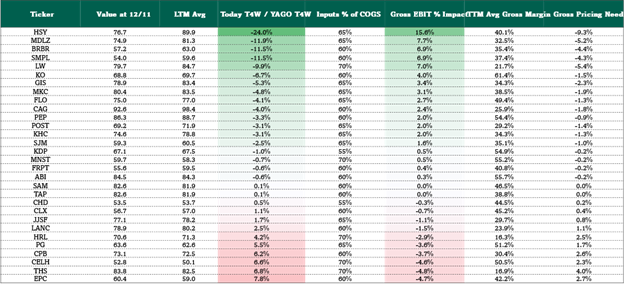
Cost tailwinds to watch: HSY (-24.0% y/y), MDLZ (-11.9% y/y), and BRBR (-11.5% y/y) maintain longer term cost tailwinds due to select food input (e.g. dairy, cocoa) commodity exposure. See Fig 1.
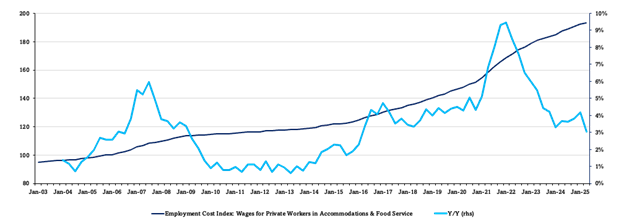
Cost inflection to watch – restaurants. Our weighted indicative input cost baskets for restaurants have reversed from summer highs (see Fig 8) – with the greatest impact for wing restaurants (-10.5% y/y). Beef remains a pressure, but most everything else has eased alongside the foodservice employment cost index also easing sharply. Watch for marginally improved earnings flexibility in 2026. And order wings.
Cost headwinds to watch: EPC (+7.8% y/y), THS (+6.8% y/y). See Fig 1.
In this weekly note, we identify spot input costs’ putative impact on the U.S. fast moving consumer goods (FMCG) value chain, most measurably impacting staples, staples retailers, restaurants & food service. Optimal’s proprietary cost factor weights ticker & sector specific cost trends using a proprietary formula based on 32 trackable spot cost inputs – 23 of which are updated as of last night, the other 9 are latest available.
Figure 1: Weekly Cost Factor Summary
Sources: Optimal Advisory Proprietary Analysis, Bloomberg, FRED, USDA, BEA
Figure 2: Weekly Cost Factor Margin Context
Sources: Optimal Advisory Proprietary Analysis, Bloomberg, FRED, USDA, BEA
Figure 3: Weekly Input Commodity Performance by Group
Sources: Optimal Advisory Proprietary Analysis, Bloomberg, FRED, USDA, BEA
Figure 4: Biggest Input Cost Movers y/y
Sources: Optimal Advisory Proprietary Analysis, Bloomberg, FRED, USDA, BEA
Figure 5: Food Sector Cost Factor
Sources: Optimal Advisory Proprietary Analysis, Bloomberg, FRED, USDA, BEA
Figure 6: Beverage Sector Cost Factor

Sources: Optimal Advisory Proprietary Analysis, Bloomberg, FRED, USDA, BEA
Figure 7: HPC Sector Cost Factor

Sources: Optimal Advisory Proprietary Analysis, Bloomberg, FRED, USDA, BEA
Figure 8: Restaurant Level Cost Factor

Sources: Optimal Advisory Proprietary Analysis, Bloomberg, FRED, USDA, BEA
Figure 9: Restaurant Employment Cost Index
Sources: Optimal Advisory Proprietary Analysis, Bloomberg, FRED, USDA, BEA
Figure 10: Staples Sector Theme Box
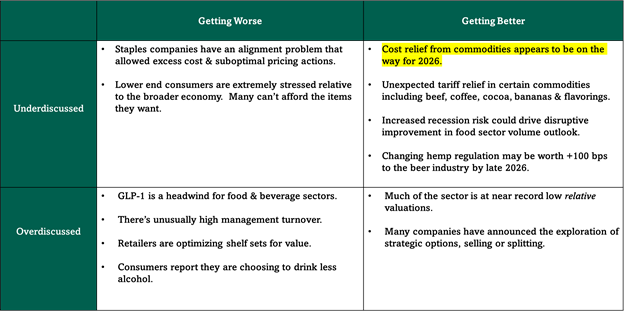
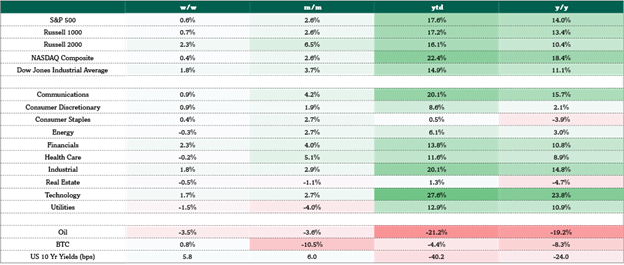
Figure 11: Market Sector Performance
Sources: Optimal Advisory Proprietary Analysis, Bloomberg