Sports Ecosystem Tracker Declines; NKE Gen Z Traffic Accelerating; News and Game of the Week; 6/18 “Every Day is Sunday” Event with Author & NYT Journalist Ken Belson: The Optimal Sports Section; ONON (+); UAA (–)
Summary: (1) Optimal’s Sports Ecosystem revenue tracker turned back negative at -1.0% T8W y/y, with Sports Betting & Data spending decelerating but remaining strong, Sports Fandom spending remaining negative but accelerating modestly, and Sports Participation spending and transactions decreasing sharply; (2) Sports equity indices outperformed the broader market, with the Equal-Weight (+1.8% w/w) and Cap-Weighted (+1.0% w/w) Ecosystem Indices both ahead of the S&P 500 (-3.0% w/w), and all sub-indices outperforming led by the Sports Betting & Data Index (+9.7% w/w); (3) ONON spending and digital traffic continue to grow and accelerate y/y alongside positive Twitter and news sentiment, while UAA spending, foot traffic, and sentiment all fell sharply, though digital traffic remained positive; (4) NKE’s US digital traffic grew on a y/y basis for the first time since February 2024, Optimal’s Online Monitor is accelerating to recent highs, and the Gen Z Attention Economy Monitor for NKE jumped to +14% in May; (5) Register for Virtual Meeting Every Day is Sunday: How Jerry Jones, Robert Kraft, and Roger Goodell Turned the NFL into a Cultural & Economic Juggernaut with Ken Belson, Author and New York Times Journalist on Thursday, June 18th at 10:30 AM ET.
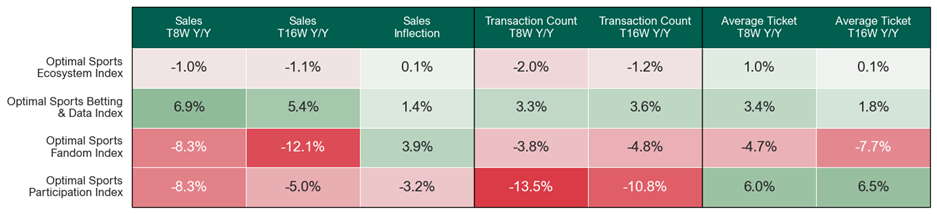
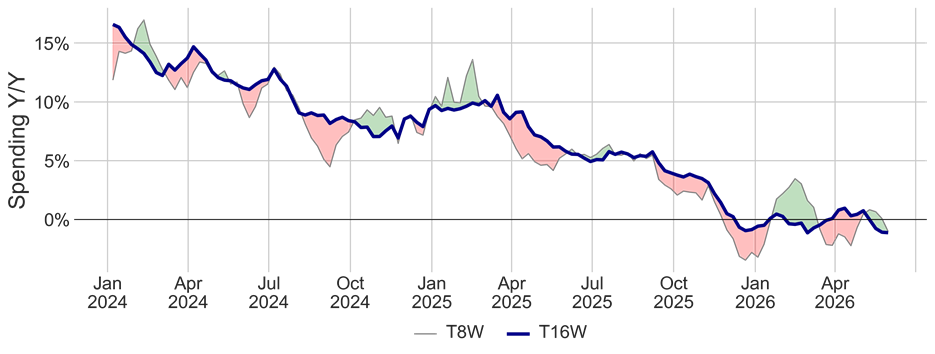
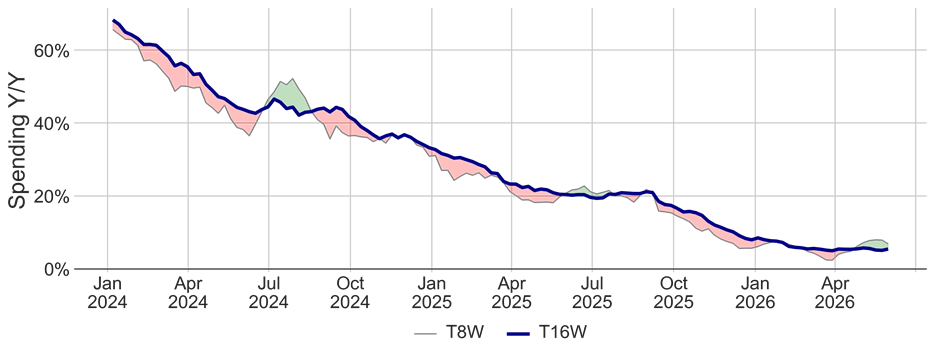
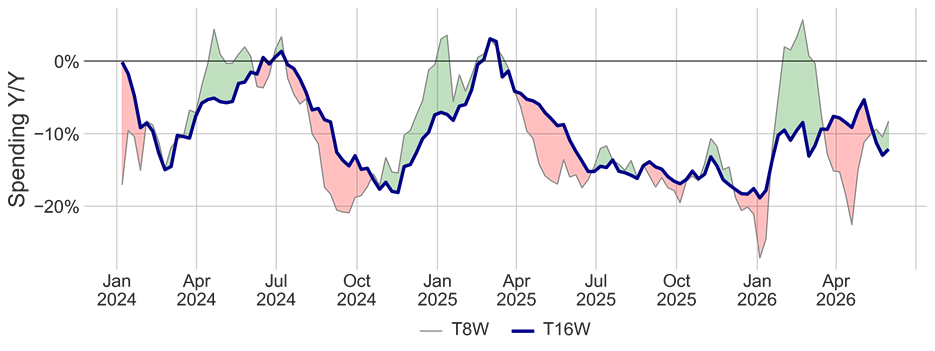
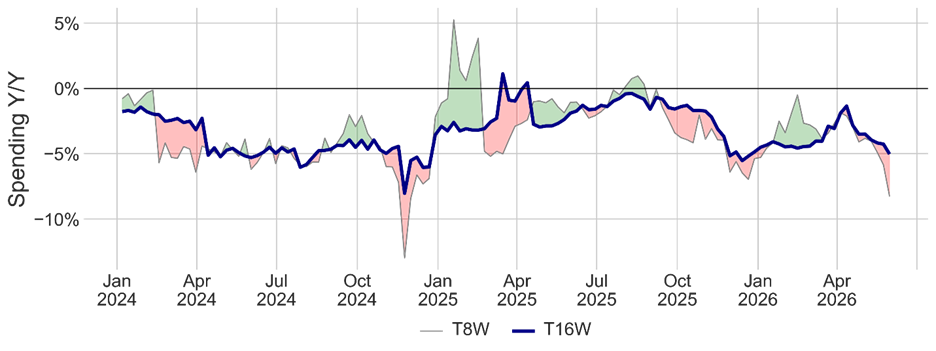
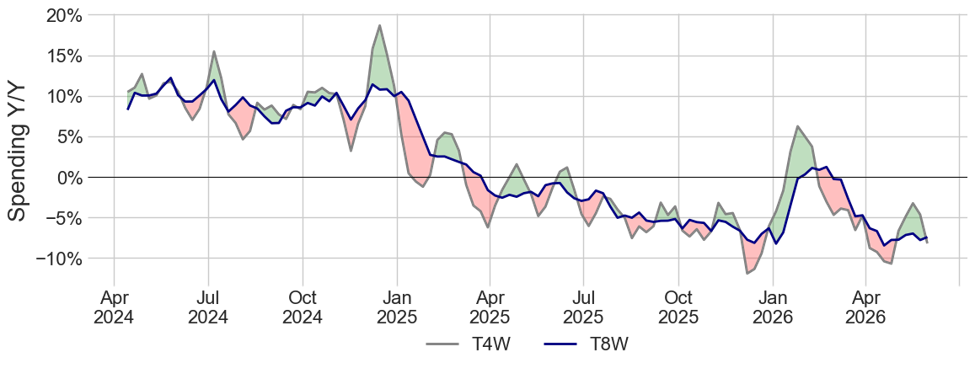
- The Optimal Sports Ecosystem Index revenue tracker turned back negative at -1.0% T8W y/y vs. -1.1% T16W, reversing last week’s flat trend. Sports Betting & Data spending remained strong at +6.9% T8W y/y (vs. +5.4% T16W), though decelerating from +7.9% last week. Sports Fandom spending fell -8.3% T8W y/y on lower transactions (-3.8%) and ticket (-4.7%), accelerating modestly from -10.5% last week. Sports Participation spending decelerated sharply to -8.3% T8W y/y (vs. -5.9% last week) coinciding with a -13.5% drop in transactions, partially offset by a +6.0% ticket increase. Experiences & Entertainment spending remains sharply down y/y.
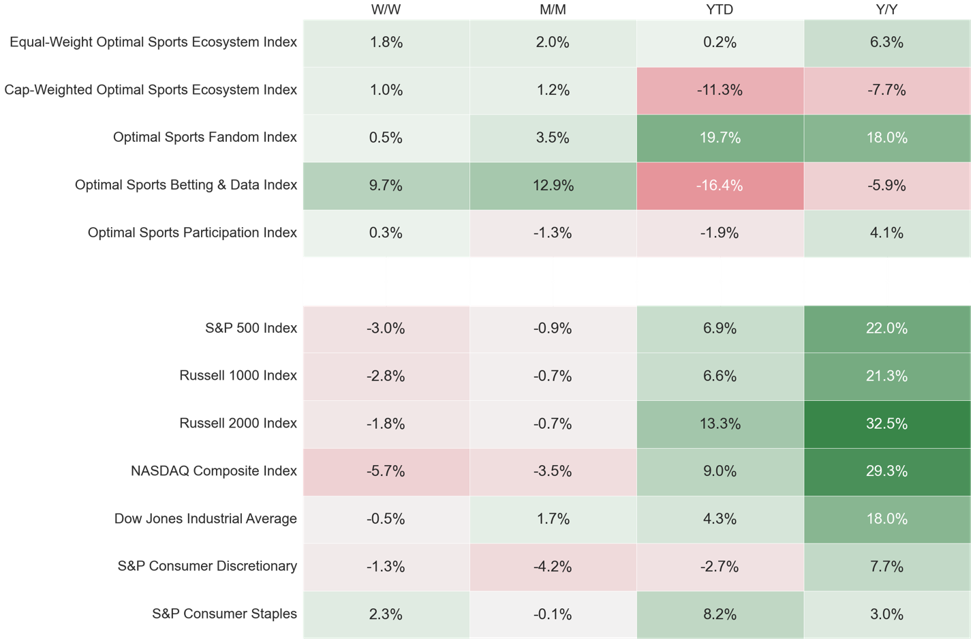
- Sports equity indices outperformed the broader market this week. The Equal-Weight Optimal Sports Ecosystem Index (+1.8% w/w) and the Cap-Weighted Optimal Sports Ecosystem Index (+1.0% w/w) both outperformed the S&P 500 (-3.0% w/w). All sub-indices outperformed the broader market, led by Optimal’s Sports Betting & Data Index (+9.7% w/w), followed by the Optimal Sports Fandom Index (+0.5% w/w) and the Optimal Sports Participation Index (+0.3% w/w).
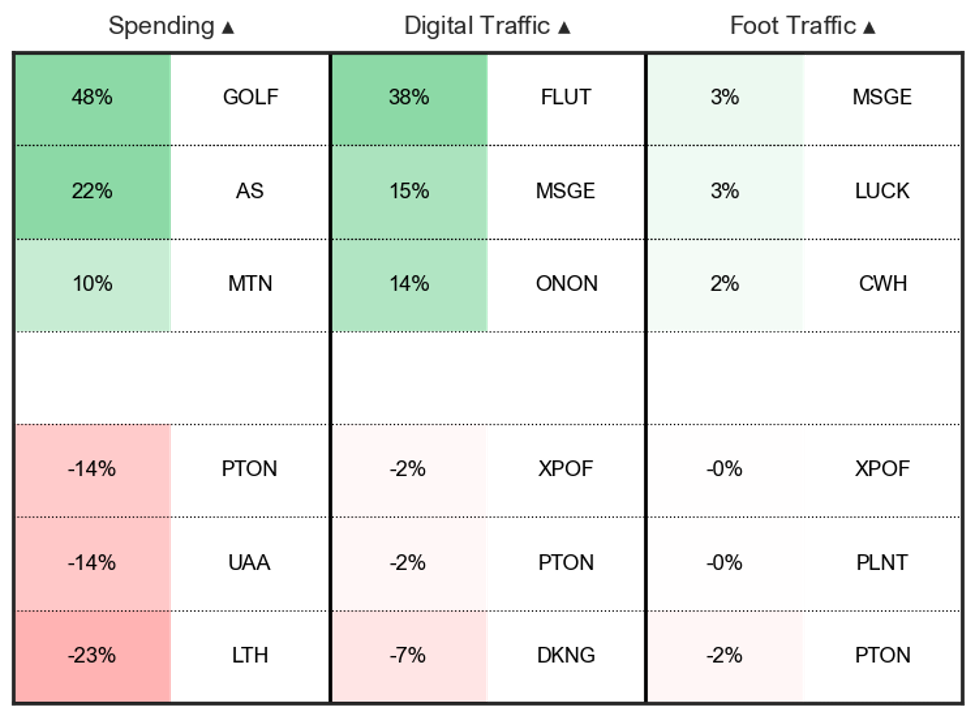
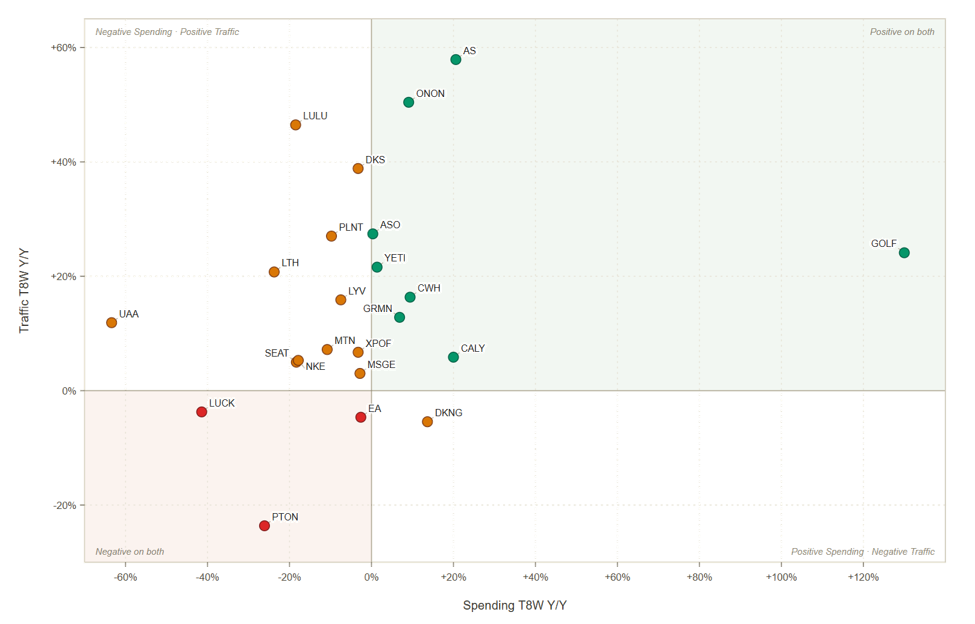
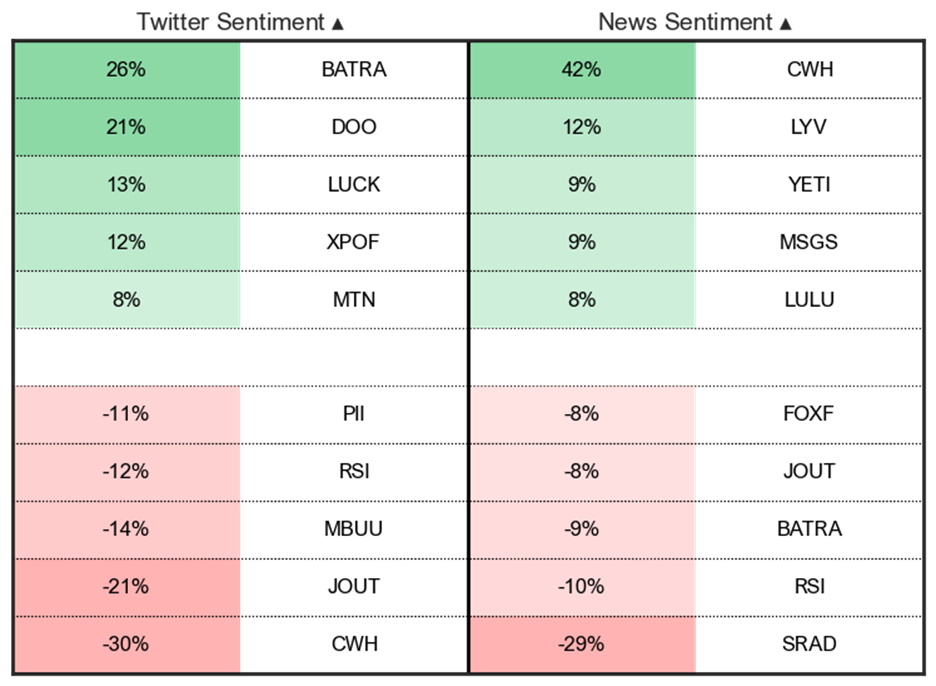
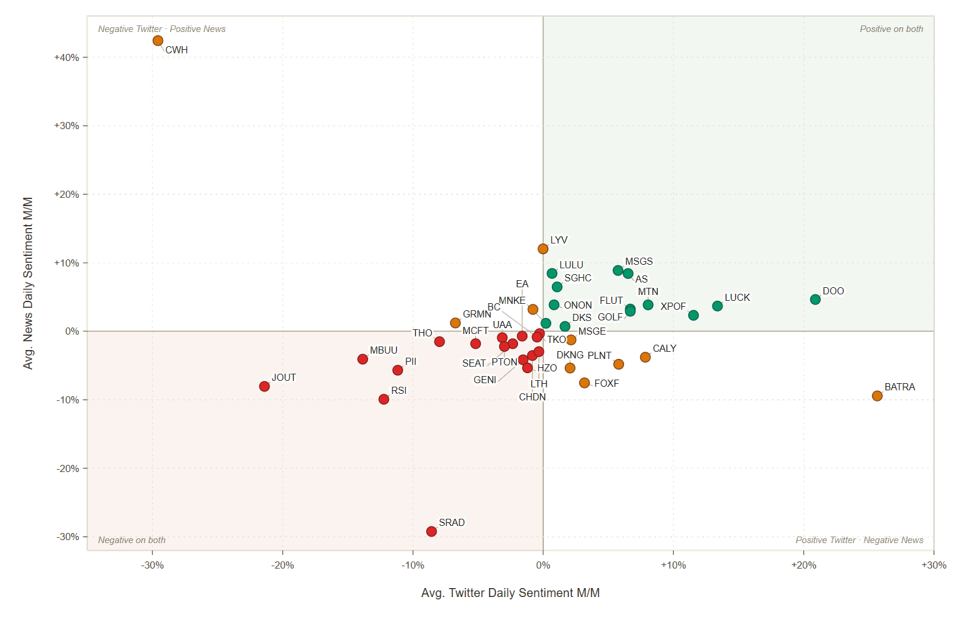
- ONON (+): Spending (+9.1% T8W y/y) continues to grow and accelerate (+2.9% relative to longer-term trend), with digital traffic up sharply (+50.4% T8W y/y) and strongly accelerating (+13.6% relative to longer-term trend). ONON’s monthly sentiment is also positive, with Twitter Sentiment up +0.8% m/m and news Sentiment up +3.9% m/m.
- UAA (–): Spending is down sharply (-63.4% T8W y/y) and inflecting further negatively (-14.3% relative to longer-term trend). Foot traffic is also negative (-2.0% T8W y/y), though digital traffic remains positive (+11.9% T8W y/y). Twitter sentiment fell -3.1% m/m and news sentiment fell -0.9% m/m.
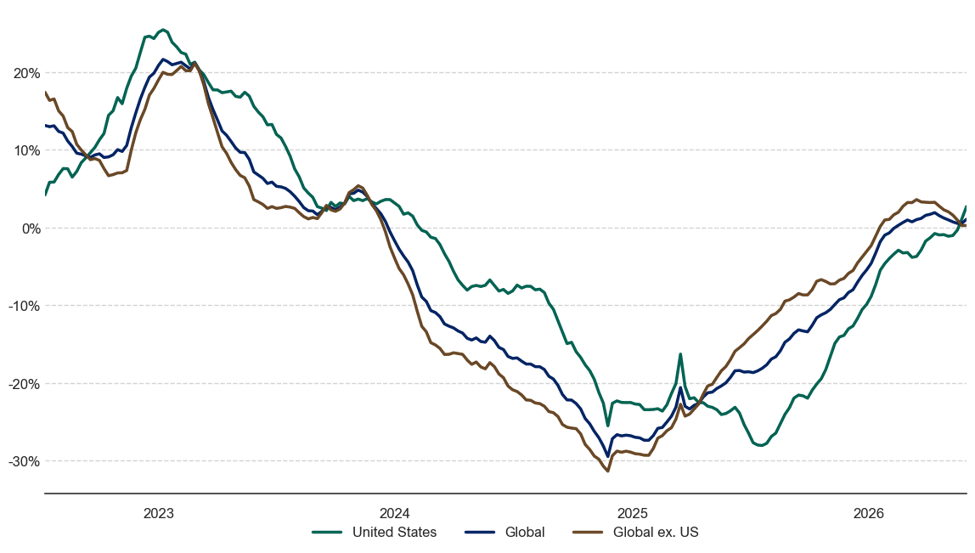
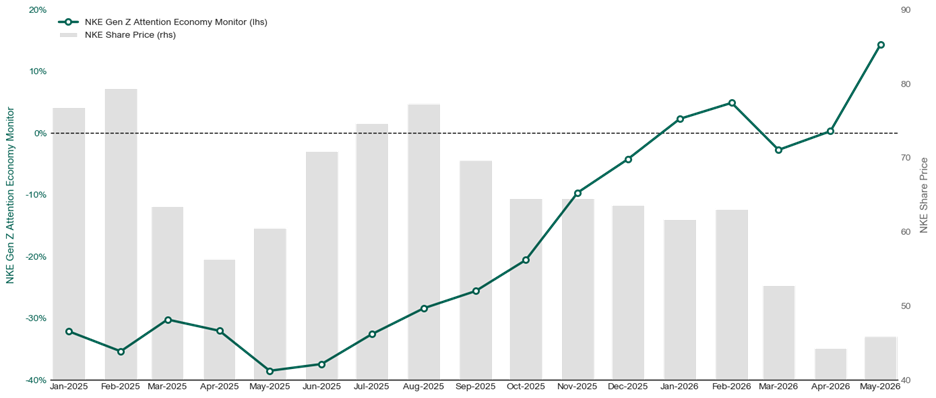
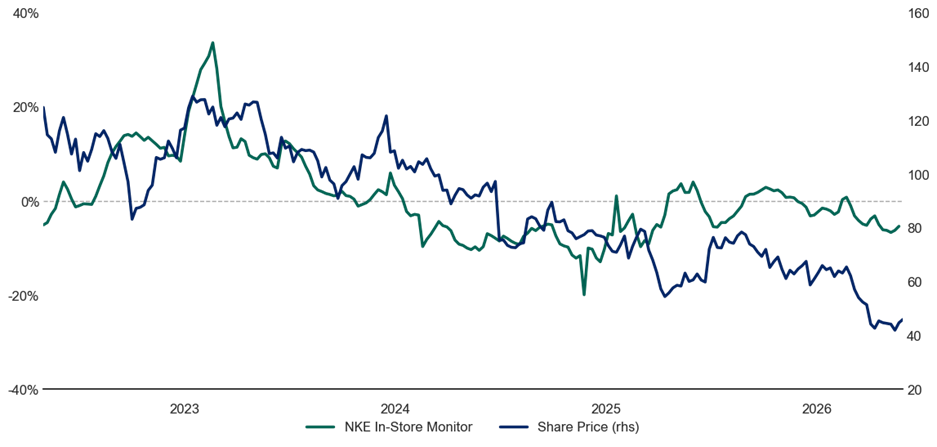
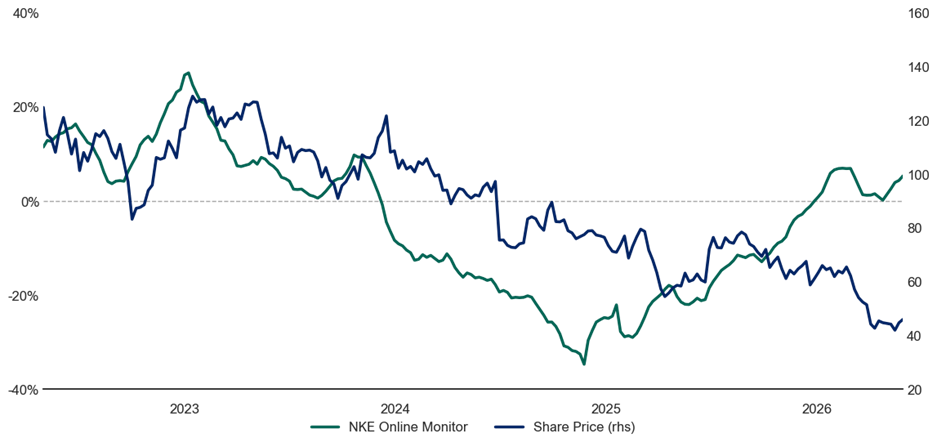
- Weekly NKE Analysis: US digital traffic inflected positive (+2.7% T16W y/y in the most recent week, up from -0.3% two weeks ago and -3.7% in mid-March) for the first time since February 2024, while global digital traffic remains positive (+1.1% T16W y/y). Optimal’s Online Monitor is accelerated sharply to +5.3% (nearing recent highs), and the In-Store Monitor has improved from recent lows but remains negative (-5.4%). NKE’s Gen Z Attention Economy Monitor jumped +14.4% in May (up from +0.3% in April), a major uptick in Gen Z engagement. News sentiment remained positive (+3.2% m/m), though Twitter sentiment was slightly negative (-0.8% m/m).
Headlines
- Headline: Todd Boehly is weighing a bid for the Seattle Seahawks at a price that could reach $9B, with Guggenheim’s Mark Walter and Middle East investors as potential partners.
- Headline: TNT/truTV’s broadcast of the USMNT’s final pre-World Cup friendly against Germany on Saturday averaged 1.5 million viewers, setting an English-language record for a USMNT friendly topping the prior high of 867,000 set just days earlier against Senegal.
- Headline: A new antitrust lawsuit filed in federal court seeks to lift restrictions on player pay from colleges in 17 states, arguing the restriction violates state NIL laws.
Game of the Week:
- New York Knicks vs. San Antonio Spurs Game 4 (June 10th 2026 @ 8:30 PM EST): The New York Knicks look to take a commanding 3-1 lead vs. the San Antonio Spurs who look to even the series at 2-2, with neither team having won on home court up to this point.
Optimal Sports Ecosystem & Sectors Analysis
Optimal Sports Ecosystem Revenue Trackers
Source: Optimal Advisory Analysis, Bloomberg Second Measure
Optimal Sports Ecosystem Index Revenue Tracker
Source: Optimal Advisory Analysis, Bloomberg Second Measure
Optimal Sports Betting & Data Index Revenue Tracker
Source: Optimal Advisory Analysis, Bloomberg Second Measure
Optimal Sports Fandom Index Revenue Tracker
Source: Optimal Advisory Analysis, Bloomberg Second Measure
Optimal Sports Participation Index Revenue Tracker
Source: Optimal Advisory Analysis, Bloomberg Second Measure
Optimal Entertainment and Experiences Revenue Tracker
Source: Optimal Advisory Analysis, Bloomberg Second Measure
Spending, Digital Traffic, & Foot Traffic Inflections (T8W vs. T16W)
Source: Optimal Advisory Analysis, Bloomberg Second Measure, Similarweb, Placer.ai
Online Traffic vs. Card Spending Growth
Source: Optimal Advisory Analysis, Bloomberg Second Measure, Similarweb
Top Twitter & News Sentiment Monthly Gainers and Declines
Source: Optimal Advisory Analysis, Bloomberg
Twitter Sentiment vs. News Sentiment Monthly Change
Source: Optimal Advisory Analysis, Bloomberg
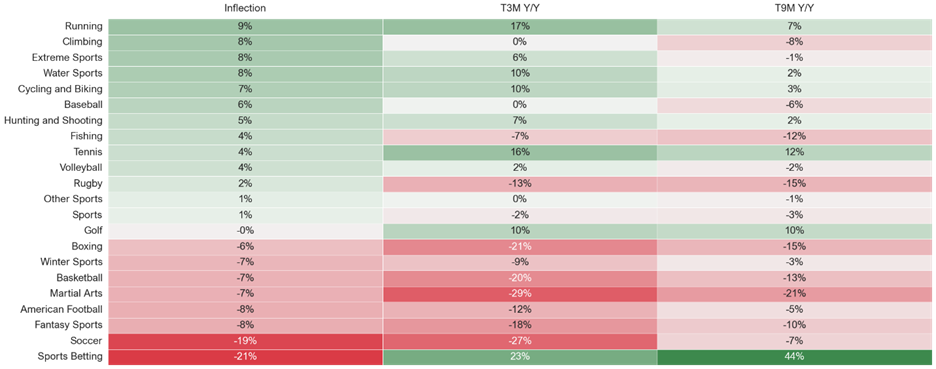
Sports Category Digital Inflections
Source: Optimal Advisory Analysis, Similarweb
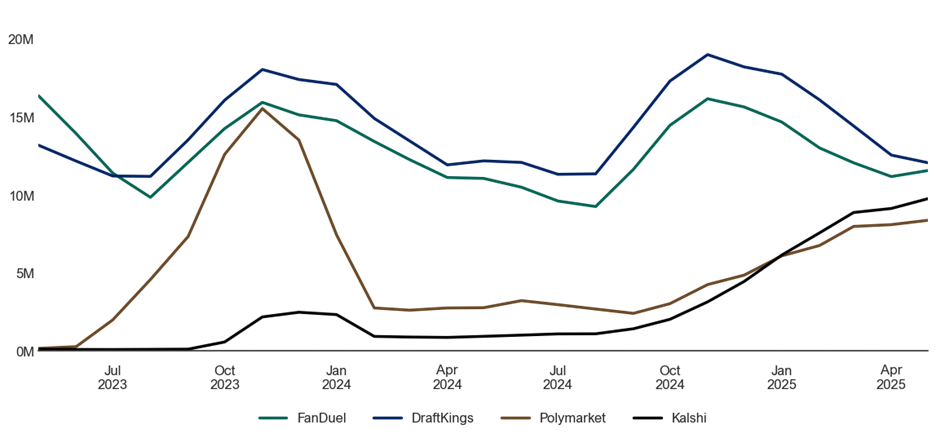
Sports Betting vs. Prediction Market Attention Economy Monitor
Source: Optimal Advisory Analysis, Similarweb
NKE Trends Weekly Analysis
NKE Attention Economy trends are slightly positive y/y globally and are increasingly positive y/y in the US (+3% y/y T16W).
NKE International Global Attention Economy Trends (T16W Y/Y)
Source: Optimal Advisory Analysis, Bloomberg, Similarweb
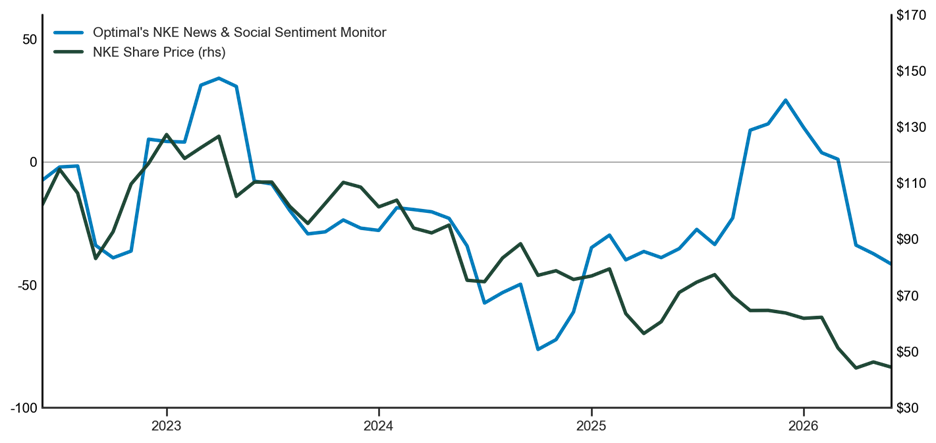
Our Gen Z Attention Economy Monitor, which tracks how Gen Z consumers engage digitally with individual brands, improved for NKE in January (+2% y/y) and February (+5% y/y), declined slightly in March (-3%), and was flat in April, but has increased by +14% y/y in May, signaling greatly improving Gen Z Attention Economy trends. Optimal’s News & Social Sentiment Monitor is lower than late 2025 after moving sharply lower following NKE’s most recent earnings call, but is still higher than late 2024.
Gen Z Attention Economy Monitor
Source: Optimal Advisory Analysis, Similarweb
NKE News & Social Sentiment Monitor
Source: Optimal Advisory Analysis, Bloomberg
Optimal’s In-Store Monitor remains negative y/y but has inflected upwards in recent weeks. Optimal’s Online Monitor has turned positive and continues to accelerate after recently flattening, and is now nearing early 2026 highs.
NKE In-Store Monitor vs. Share Price
Source: Optimal Advisory Analysis, Placer.ai, Bloomberg
NKE Online Monitor vs. Share Price
Source: Optimal Advisory Analysis, Similarweb, Bloomberg
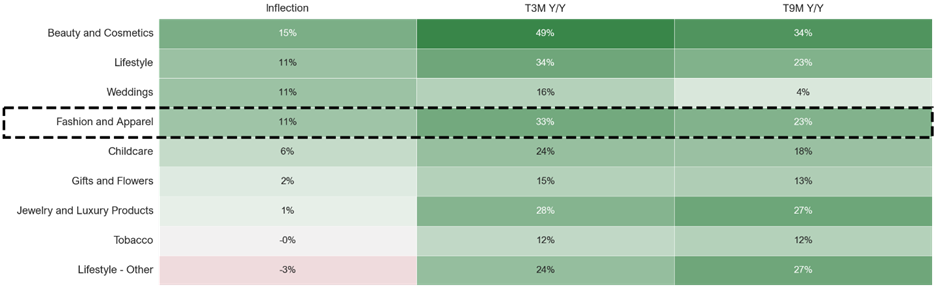
We also note improving online traffic for lifestyle brands broadly and for fashion and apparel brands specifically in May, with traffic both improving and accelerating and inflections also outpacing April numbers (+11% vs. +8%).
Online Traffic to Fashion & Apparel Websites is Improving and Accelerating
Source: Optimal Advisory Analysis, Similarweb
Equity Performance
Index & Sector Performance
Source: Optimal Advisory Analysis, Bloomberg, prices intraday 6/9/2026
Valuation Snapshots
Optimal Sports Betting & Data Index Components Valuation Snapshot
Source: Optimal Advisory Analysis, Bloomberg
Optimal Sports Fandom Index Components Valuation Snapshot
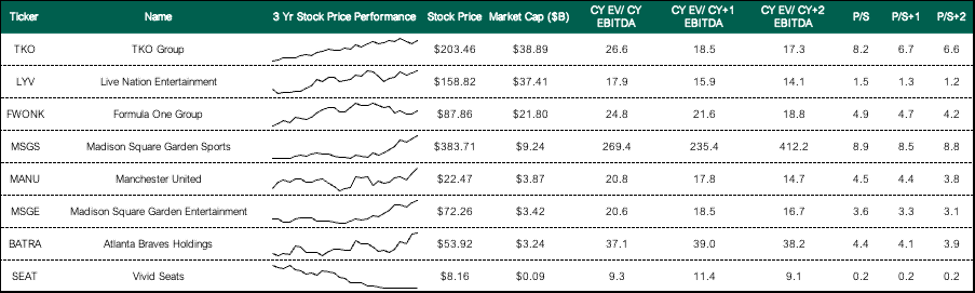
Source: Optimal Advisory Analysis, Bloomberg
Optimal Sports Participation Index Components Valuation Snapshot
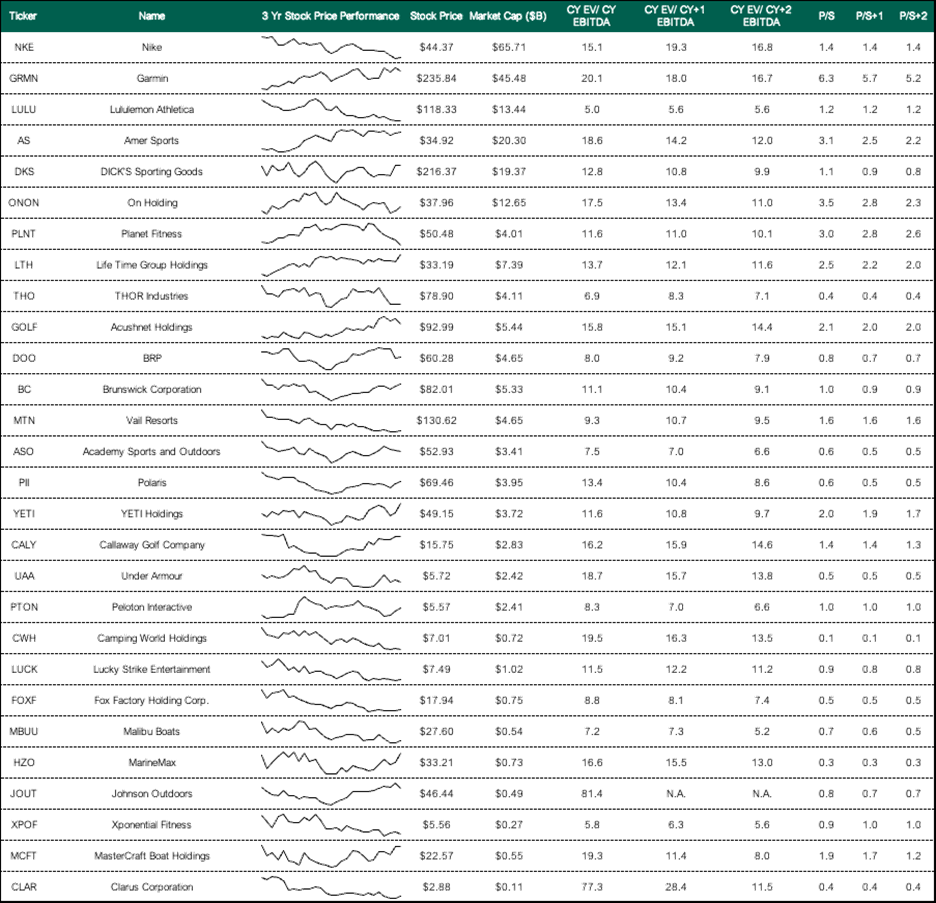
Source: Optimal Advisory Analysis, Bloomberg