Ticket by Sector Intrigue from Auto Parts to Consumer Fintech; Spend Trend More Stable; Gas Prices Retreating from Highs; Wealth Effect Accelerated: Macro Monday
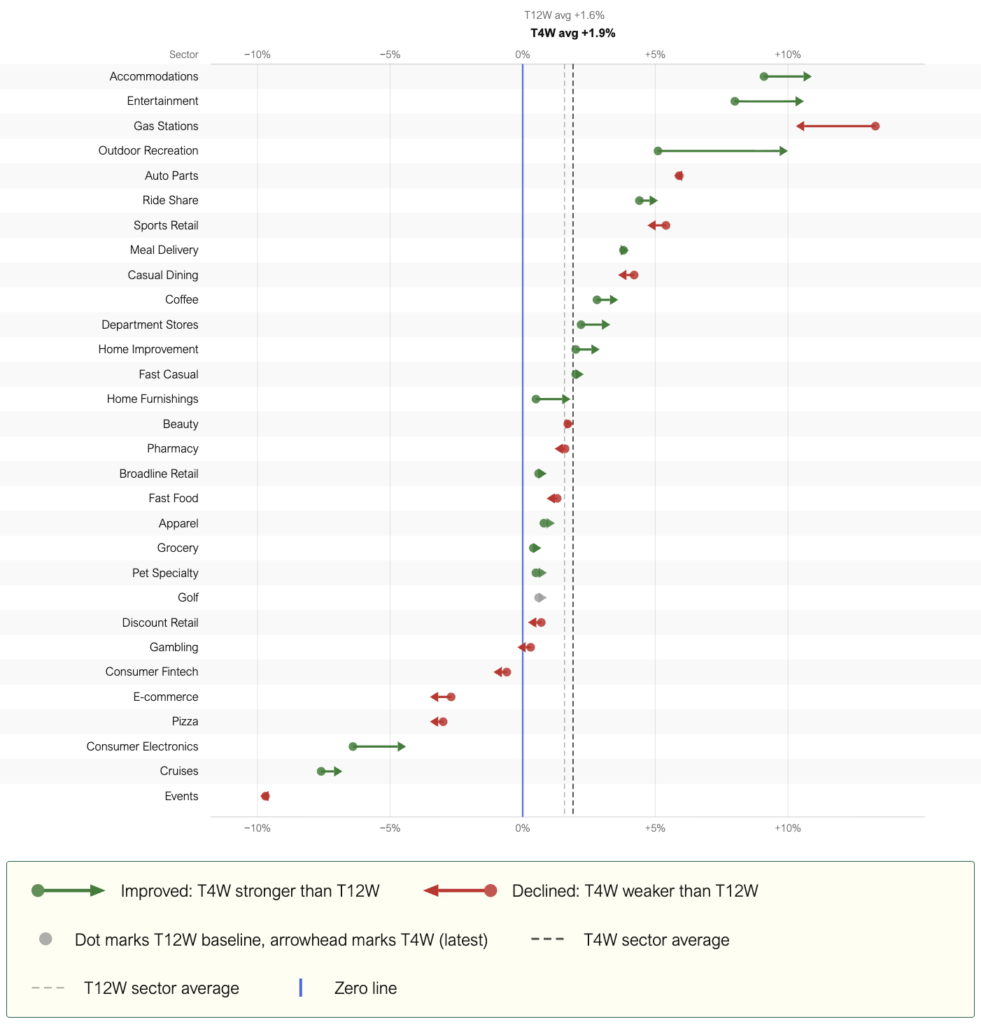
Summary: (1) We note strength in average transaction in accommodations, entertainment and outdoor recreation, gas station recedes a bit, and categories from pizza to consumer fintech (and more) remain pressured, See Chart of the Week … what is clear is that spending growth is transaction size growth; (2) Consumer Velocity ticked up slightly to +2.0% y/y T4W with T12W running up +2.3%, with T4W < T12W for the seventh straight week; underlying trend still slightly soft vs. post-2022 average, see Fig 1; (3) Housing activity remains largely frozen with 30Y FRM at 6.48% (-38 bps y/y T4W) and home prices flat y/y, though precursor metrics show some positive inflection, see Fig 3-6; (4) Gas prices have retreated from highs, but gas inflation remains the dominant macro signal at +59% y/y T4W , see Fig 7; (5) Sentiment hitting all-time lows (44.8) for the second straight month, down -14% y/y, with lower-income (-15% T3M) and middle-income (-11% T3M) worsening while upper-income is flat, see Fig 9-12; and (6) Wealth Effect Index is at +16% y/y, increasing for the 11th consecutive week driving the top end of the K-shape, see Fig 13-16.
Chart of the Week: Average Transaction Inflections, by category
Source: Optimal Advisory Analysis, Bloomberg Second Measure
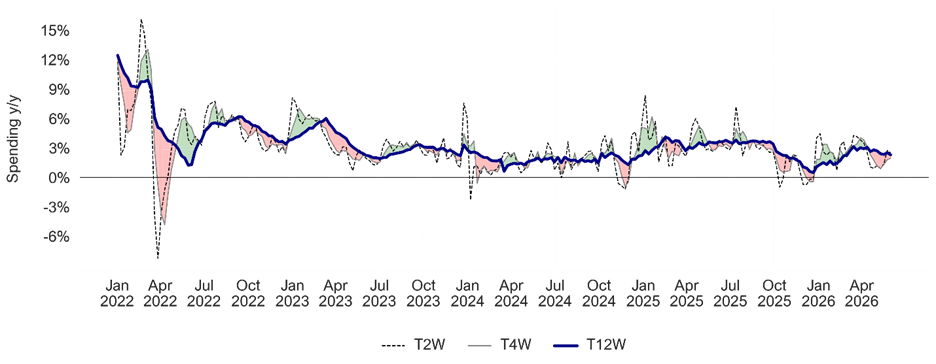
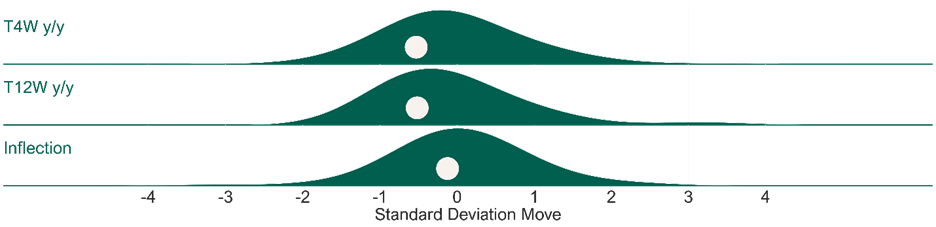
Our Consumer Velocity tracker improved from last week, up +2.0% y/y T4W following +1.8% y/y the prior week, while the T12W trend decelerated slightly to +2.3% y/y (from +2.5%). The underlying trend remains slightly soft (0.5 standard deviations below the post-2022 average on a T4W and T12W basis). The T4W vs. T12W inflection was -0.4 pts, the seventh consecutive week of shorter-term growth lagging longer-term (although the gap is narrowing). See Fig 1-2.
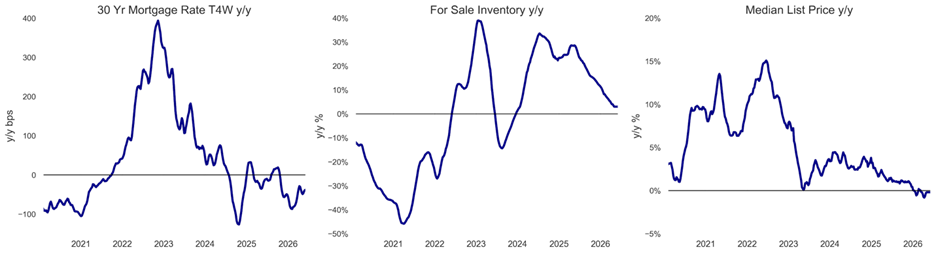
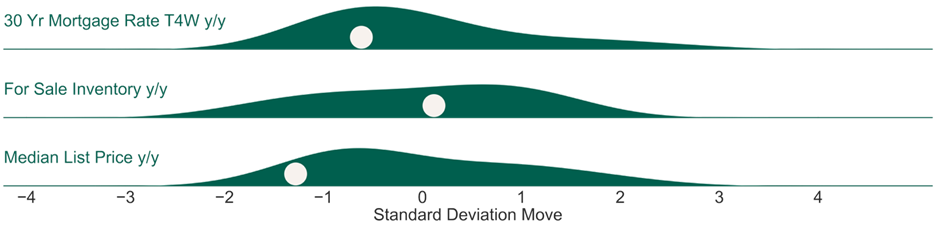
Housing activity remains virtually frozen with precursor metrics also strained by higher borrowing costs. US 30Y FRM rate is up to 6.48%, running down -38 bps y/y on a T4W basis but at the highest levels since last September (0.6 standard deviations below average since 2020). MBA’s mortgage applications for purchase index is running up +3% y/y while refinance applications index is running up +19% y/y. Median home prices are flat y/y. Roughly 18% of US GDP is related to the selling, building, fixing, lending to, and furnishing of homes – velocity matters for the economy. See Fig 3-6.
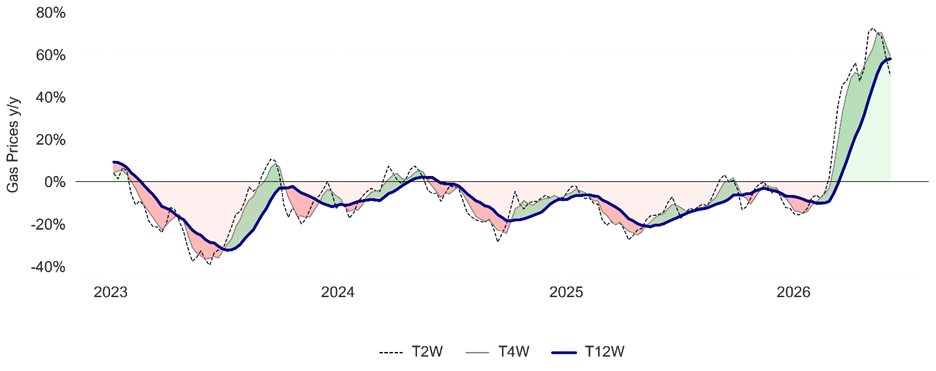
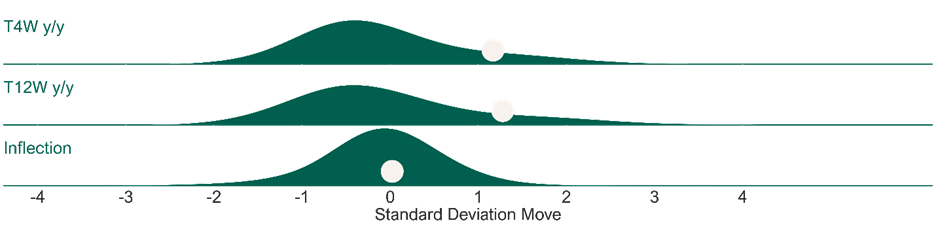
Gasoline inflation remains the dominant macro signal as the latest weekly print is up +47% y/y, with the T4W now at +59% y/y and the T12W at +58% y/y. The T4W reading is 1.2 standard deviations above average, but the T4W vs. T12W inflection is now only +1.4 pts. We continue to flag that utilities (electricity and heating fuel) run about 9% of lower-income household spending vs. 4% for higher-income households – compounding the squeeze at the bottom of the income distribution. See Fig 7-8.
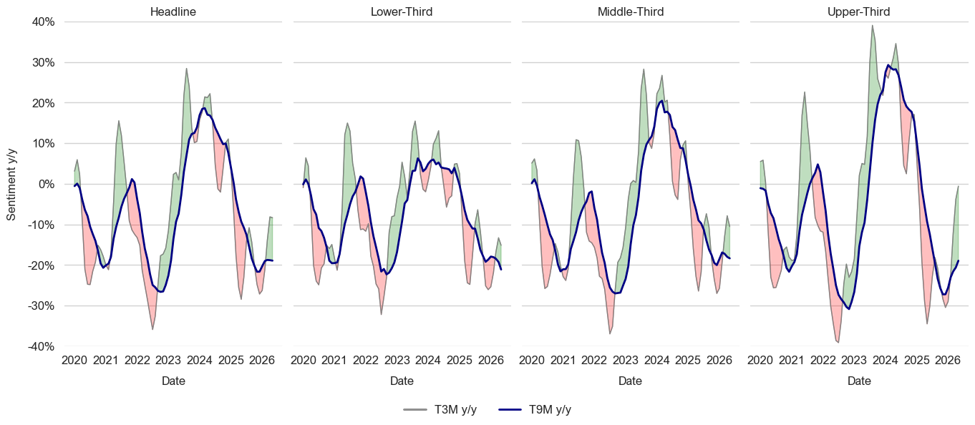
Sentiment is at all-time lows (currently at 44.8) for the second consecutive month, down -14% y/y this month despite lapping exceedingly weak comparisons (revised even further downward). Overall, headline Sentiment is down -14% y/y this month alone and down -8% on a T3M basis (0.7 standard deviations below average) and -19% y/y on a T9M basis (1.8 standard deviations below average). Upper-third income Sentiment is down -1% y/y on a T3M basis (0.1 standard deviations below average), after declining -4% y/y T3M last month. Middle-income Sentiment is down -11% y/y on a T3M basis (0.8 standard deviations below average) after declining -8% y/y T3M last month, and lower-income Sentiment has declined -15% y/y on a T3M basis (1.3 standard deviations below average) compared to -13% last month. See Fig 9-12.
Consumer “Wealth Effect” continued momentum. Optimal Advisory’s Wealth Effect Index is at +16% y/y (0.5 standard deviations above average since the start of 2022 and higher for 11 consecutive weeks). Despite markets selling off late last week, equity returns have been strong, shrugging off conflict in the Middle East and higher energy prices, while beginning to lap a softer market from Spring 2025. With home prices flat y/y we note the “flywheel” of wealth effect turning higher. See Fig 13-16.
Our Multifactor Macro Market Model has been suggestive of March 2026 softness, rebound. Optimal’s Multifactor Macro Market Model projects the S&P 500 as well as bull and bear cases based on lagged data for 12 macroeconomic factors. The model suggested the S&P 500 to fall to just below 6000 by March, before rebounding back up to 6400 by May. We use this model as a guide to how macro would guide the market, given our analysis of current variables. This is, of course, outside of other factors at work. See Fig 17-18.
Figures 1-2: Optimal Advisory Consumer Velocity Monitor
Source: Optimal Advisory Analysis, Bloomberg Second Measure
Consumer Spending y/y Relative to Historical Average
Source: Optimal Advisory Analysis, Bloomberg Second Measure
Figures 3-6: Housing Kinetic Energy
Source: Optimal Advisory Analysis, Freddie Mac, Zillow, Redfin
Mortgage Rates, For Sale Inventory, & Median List Price y/y Relative to Historical Averages (Since 2020)
Source: Optimal Advisory Analysis, Freddie Mac, Zillow, Redfin
Figures 7-8: Gas Prices y/y
Source: Optimal Advisory Analysis, Bloomberg
Gas Prices y/y Relative to Historical Averages (Since 1992)
Source: Optimal Advisory Analysis, Bloomberg
Figures 9-12: Consumer Sentiment T3M and T9M y/y
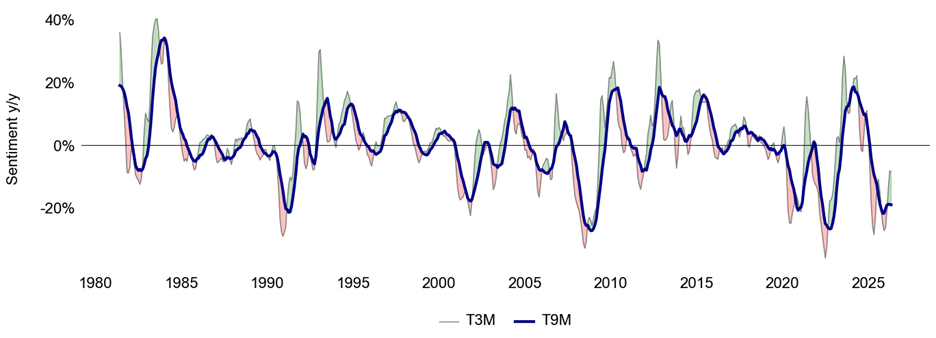
Sentiment y/y by Income Tercile Relative to Historical Averages
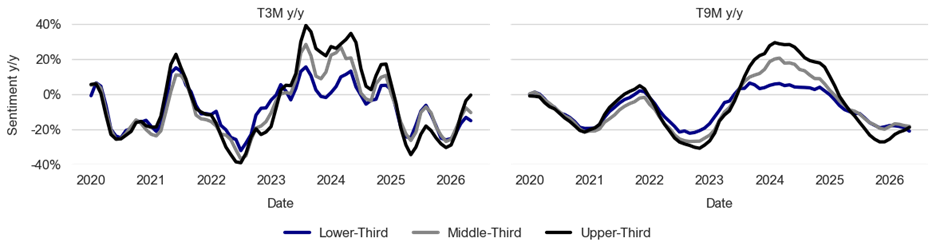
Comparison of Sentiment y/y Across Income Terciles
Source: Optimal Advisory Analysis, University of Michigan Consumer Survey
Figures 13-16: Consumer Wealth Effect & Components y/y
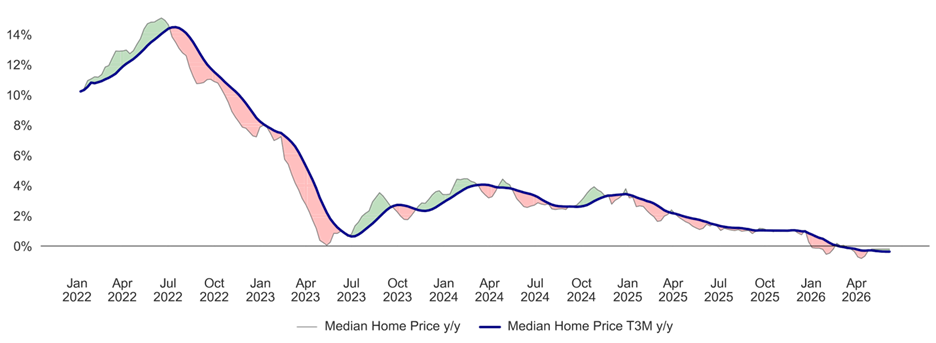
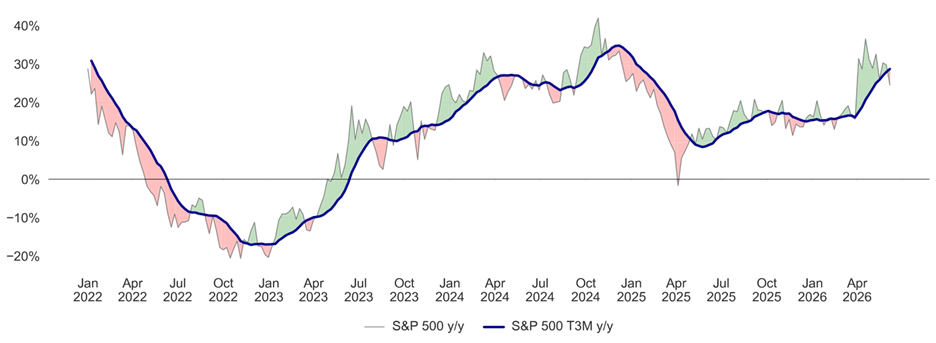
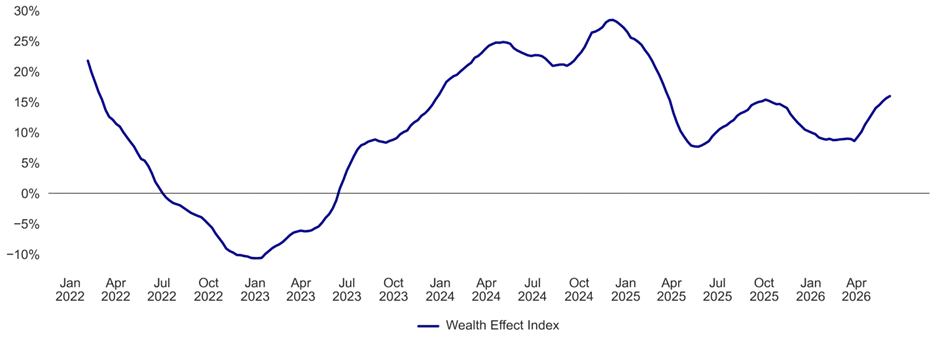
Source: Optimal Advisory Analysis, Bloomberg, Zillow, Redfin
Median Home Price y/y, S&P 500 y/y, & Wealth Effect Index (Since 2022)
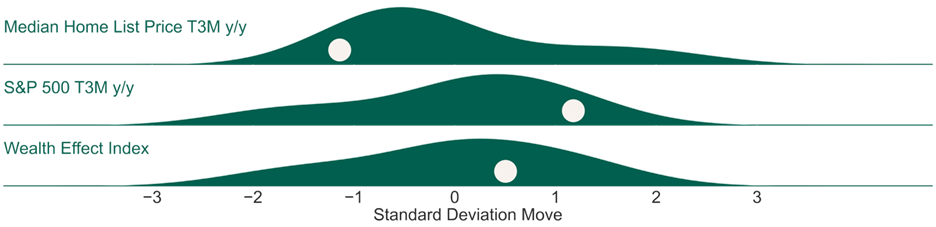
Source: Optimal Advisory Analysis, Bloomberg, Zillow, Redfin
Figures 17-18: Optimal Advisory Multifactor Macro Market Model
Historical Test Predictions vs. Actual (On Test Data Only)
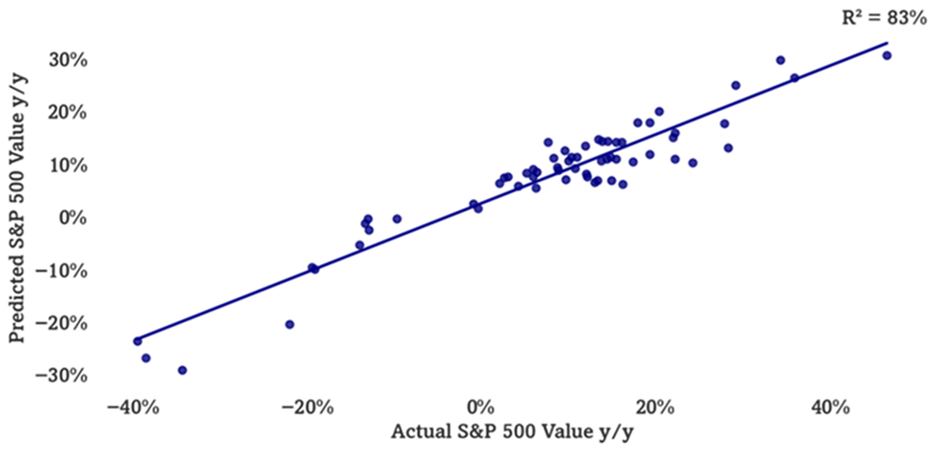
Source: Optimal Advisory Proprietary Analysis, Bloomberg, FRED, BLS, BEA, OECD, University of Michigan Consumer Sentiment Survey, U.S. Census Bureau, FRB
Actual & Projected S&P 500 (Including Training & Test Data) with Confidence Intervals
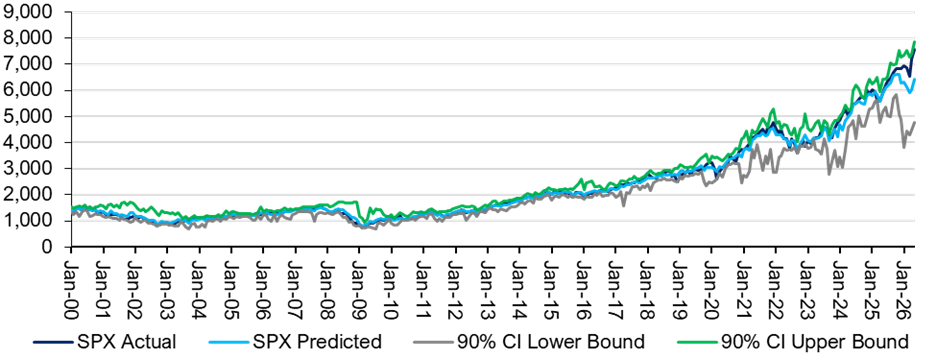
Source: Optimal Advisory Proprietary Analysis, Bloomberg, FRED, BLS, BEA, OECD, University of Michigan Consumer Sentiment Survey, U.S. Census Bureau, FRB
Figure 19: Index & Sector Performance
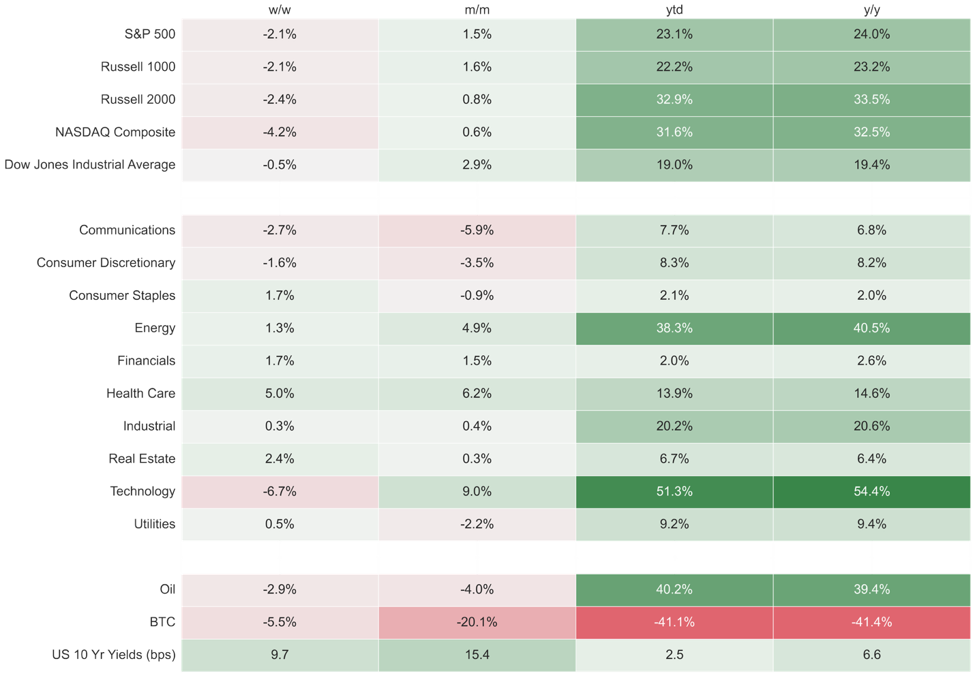
Source: Optimal Advisory Analysis, Bloomberg, prices intraday 6/8/2026