Why Sports is Everything & Who Benefits Most … Launching Optimal’s Coverage of The Sports Ecosystem
- The $2.3 trillion global sports economy is growing at 2.2x global GDP.
- A self-reinforcing flywheel of consumer tendencies is driving this ecosystem including fandom, gambling, and participation.
- We launch the Optimal Sports Ecosystem Index comprised of 44 companies in 3 subcategories – we identify, unpack, and these subcomponents.
- We discuss selected public market callouts including CALY, GOLF, NKE, SRAD, MSGS/MSGE, MANU, BATRA.
In this report we expand Optimal’s coverage into the global $2.3 trillion sports ecosystem that is growing at roughly 2x GDP. We identify three ongoing drivers of this growth (fandom & financialization of sports assets; sports betting; and consumer participation in existing and new sports). These drivers are aligned with behavioral tendencies of the 21st century consumer.
Sports economy revenues have grown by a CAGR of 6.5% over the past decade, including media rights (7%), operating revenues (6-7%), and related consumer expenditures (5%). This growth has outpaced nominal world GDP growth by about 350 bp (or 2.2x) over the same timeframe. We expect the sports ecosystem to continue to grow at a similar pace over the next 5 years. The three key drivers of the sports economy include:
- Fandom & Financialization (The Scarcity Value of a Unified Consumer Touchpoint). Sporting events are one of the last forms of widely consumed, live & unscripted content in a fragmented market, making sports media rights exponentially more valuable. As an increasing number of consumers turn to streaming and alternative news sources over live television, sports viewership and data has become more precious to broadcasters and advertisers. At the same time, the financialization of sports as an asset class with heavy inflows combined with inherent scarcity of seasoned sports properties has further pushed valuations upwards. As private equity firms and sovereign wealth funds increasingly invest in sports teams, the expanding growth opportunities and scarcity are driving sports property valuations to new heights.
- Sports Betting & Data – The Biggest Driver of The Flywheel. The popularization and legalization of sports betting drives consumer interactions with sports leagues and brands. Even relative to other sports fans, sports bettors watch far more live events, attend more games, listen to more podcasts, and buy more merchandise.
- Sports Participation & Reinvention. Women’s sports, youth sports, and emerging sports provide growth to a continually evolving ecosystem. Increased viewership of women’s sports, participation in youth sports (especially sports such as volleyball and women’s flag football), and interest in emerging sports such as pickleball, padel, & esports have driven consumer spending, sports equipment & apparel brands, sports betting, team owners, travel, & data companies.
This report unpacks the trends and drivers of the sports ecosystem, identifies selected inflections within public market players, and analyzes component fundamentals as the sports ecosystem continues to take over the economy.
The Optimal Sports Ecosystem Index
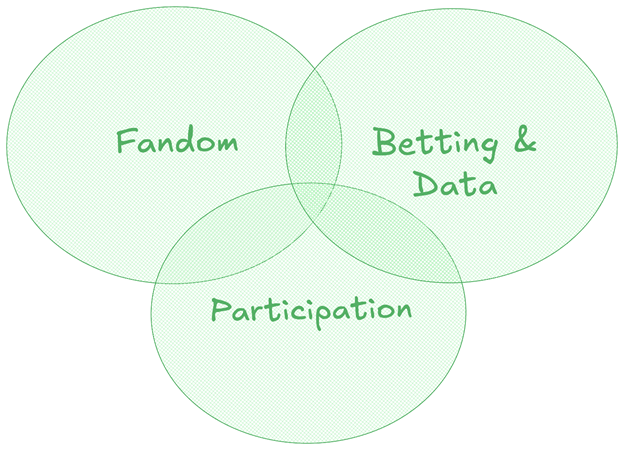
Driven by the three key drivers listed above, we divide our coverage into the following three categories:
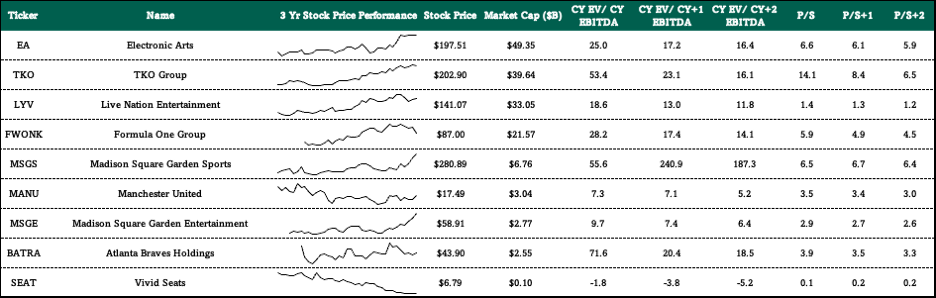
- Sports Fandom
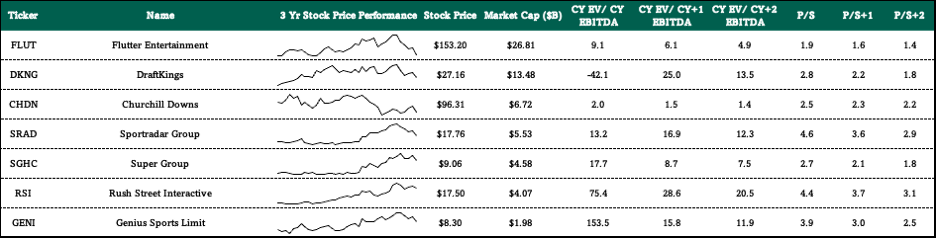
- Sports Betting & Data
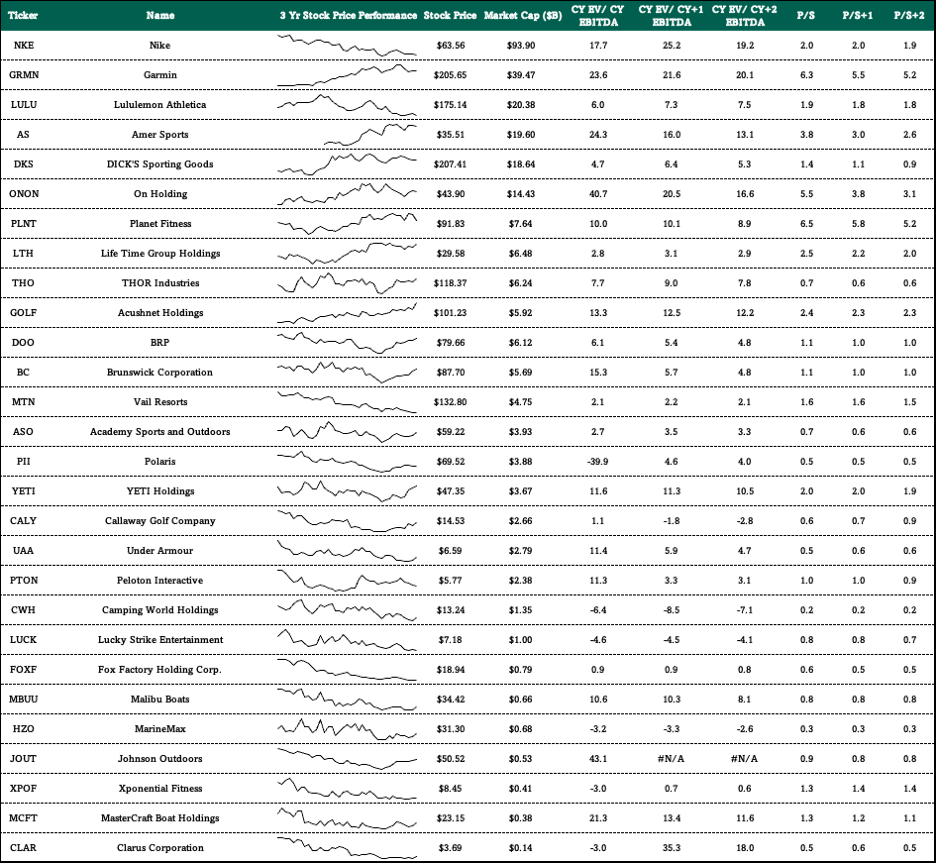
- Sports Participation
Figure 1: The Sports Flywheel: Our Ecosystem Categories
Source: Optimal Advisory analysis
Figure 2: Optimal Sports Ecosystem Index Components (Sorted by Market Cap)
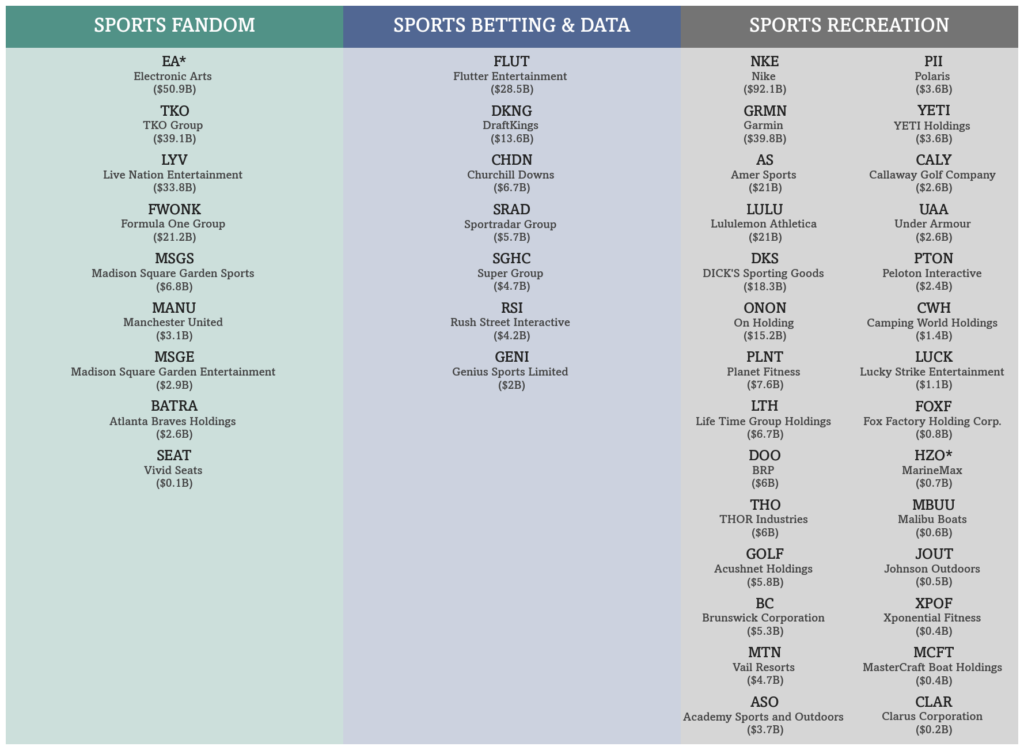
*EA, HZO included in historical and component indices despite ongoing M&A
Source: Optimal Advisory analysis
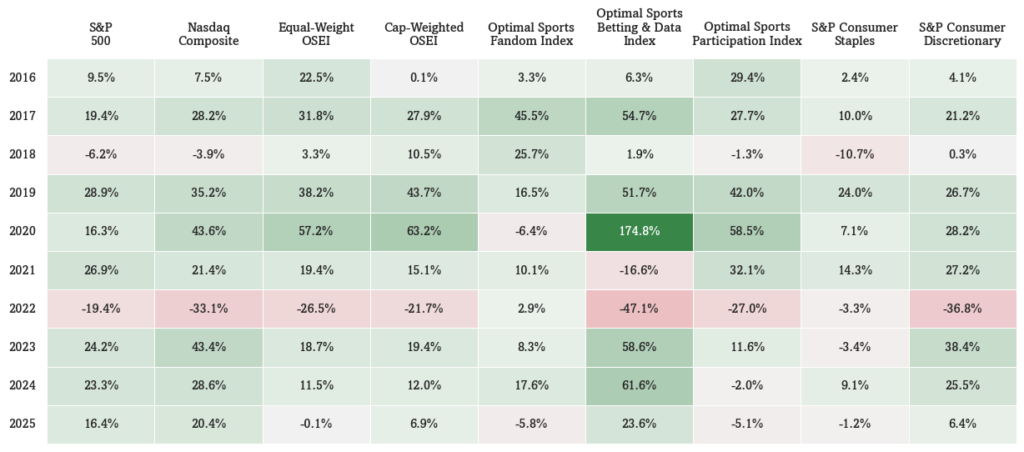
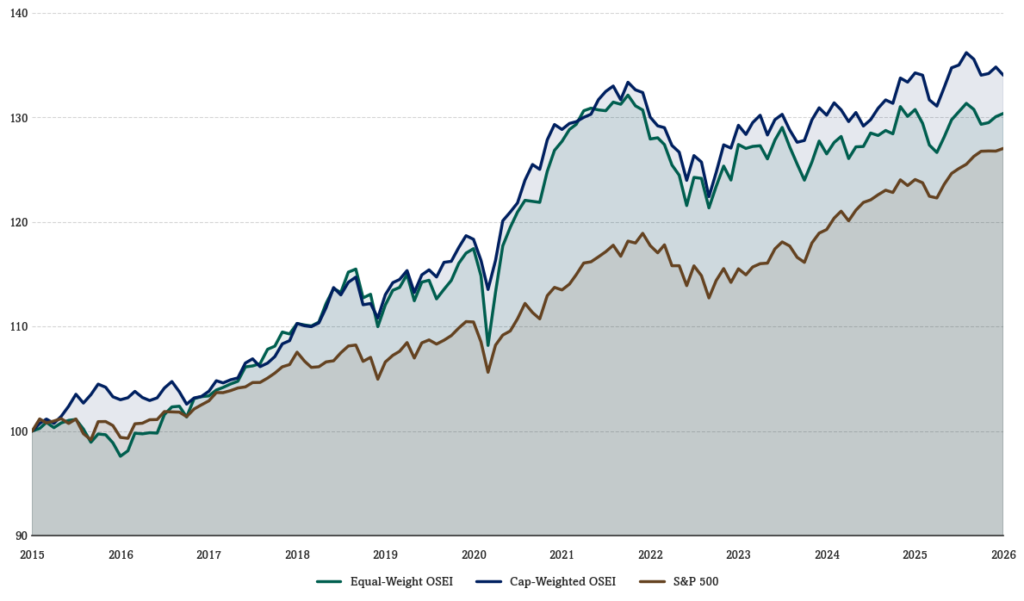
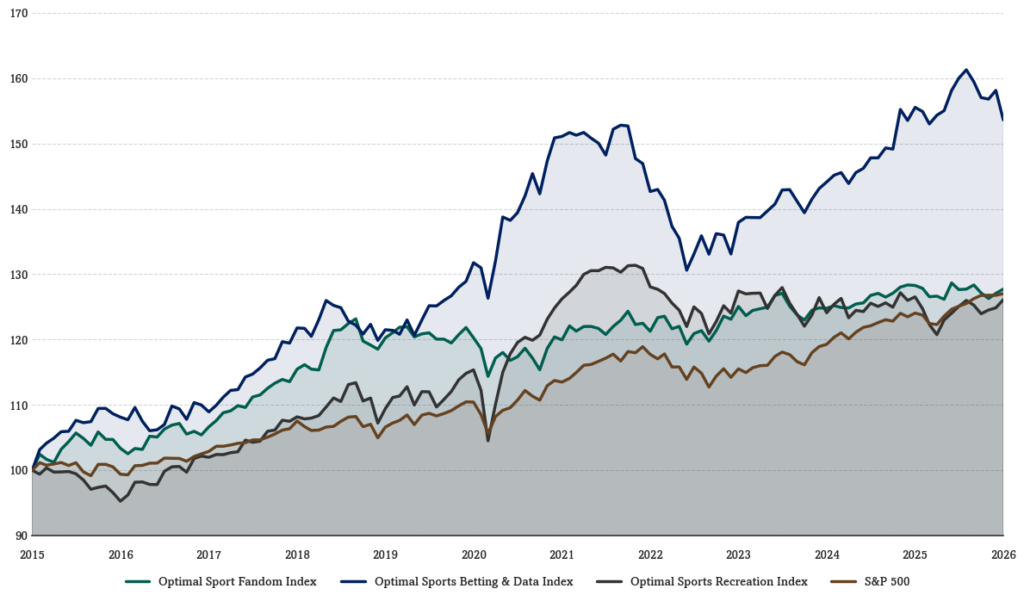
Below we calculate the performance of our index over time. Note that for our equal-weight indices we rebalance monthly.
Figure 3: OSEI (Optimal Sports Ecosystem Index) Annual Returns vs. Benchmarks
Source: Optimal Advisory analysis, Bloomberg
Figure 4: Optimal Sports Ecosystem Index (Log Scale)
Source: Optimal Advisory analysis, Bloomberg
Figure 5: Optimal Sports Equal-Weight Category Index Performance (Log Scale)
Source: Optimal Advisory analysis, Bloomberg
Figure 6: Optimal Sports Fandom Index Comps
Source: Optimal Advisory analysis, Bloomberg
Figure 7: Optimal Sports Betting & Data Index Comps
Source: Optimal Advisory analysis, Bloomberg
Figure 8: Optimal Sports Recreation Index Comps
Source: Optimal Advisory analysis, Bloomberg
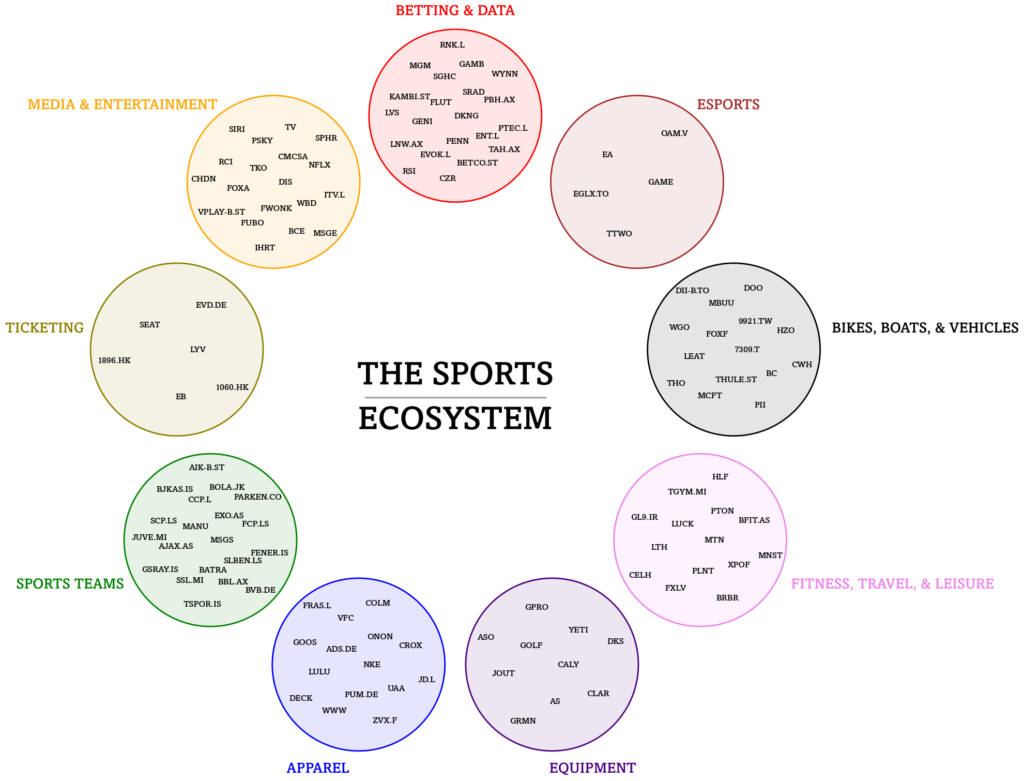
Beyond the 44 tickers included in our indices, we also continually monitor the larger publicly traded sports ecosystem, which we categorize as follows:
- Media & Entertainment
- Ticketing
- Sports Teams
- Apparel
- Equipment
- Fitness, Travel, & Leisure
- Bikes, Boats, & Vehicles
- Esports
- Betting & Data
Figure 9: The Broader Sports Ecosystem
Source: Optimal Advisory analysis
Many of the other largest companies in the world not included have a strong presence in the sports world as well, such as AMZN (such as Thursday Night Football), APPL (MLS Season Pass & Friday Night Baseball), & GOOG (YouTube TV).
Selected Optimal Public Market Callouts
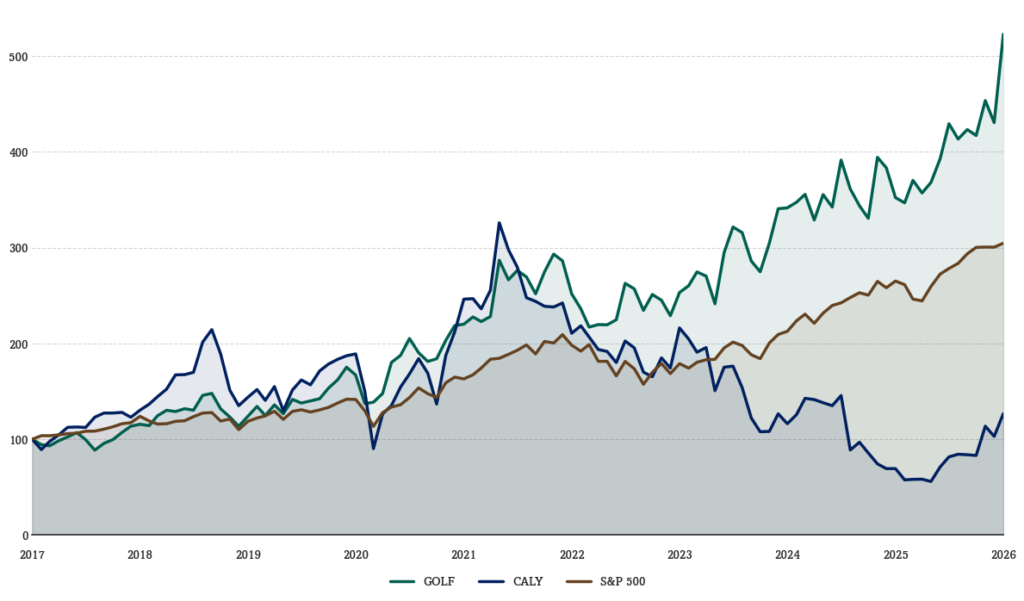
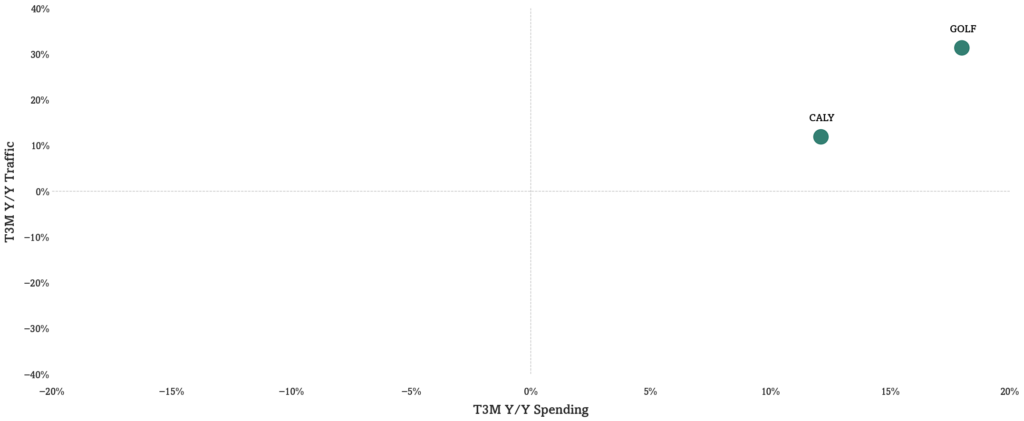
Sure, Tiger is 50, but golf (CALY/GOLF) is big again & there is a big youth movement. Golf’s boom since Covid is well documented, but we note the youth movement gives the trend some staying power. Golf is the second fastest growing sport among age 6-12 year olds, the fastest growing sport among age 13–17 year olds, and boys golf participation in high school sports is up 9% over the past 10 years (see figure 11). Moreover, our “attention economy monitor” on golf indicates persistent positive trends (and the rate of change remains positive). For example, global digital traffic to Callaway Golf Brand is up 24% T3M y/y and 16% T6M y/y, 29% & 25% respectively for TravisMathew, and 18% and 12% respectively for GOLF summed across all brands (and card spending is also up 18% y/y for GOLF). Notably, both traffic and card spending for CALY and GOLF are improving rapidly (see Figure 12 below). These offseason trends are suggestive of potential for CY26. Now unconnected to the volatility of Topgolf, we see a clearer story for CALY – its share price having woefully underperformed over the last 5 years (-49% compared to GOLF +137%).
Figure 10: Performance of GOLF, CALY, S&P 500 Since 2017
Source: Optimal Advisory analysis, Bloomberg
Figure 11: Youth Golf Participation Growth

Source: Optimal Advisory analysis, Sports & Fitness Industry Association, National Golf Foundation, The National Federation of State High School Associations
Figure 12: GOLF & CALY are Both Showing Improved Card Spending and US Online Traffic
Source: Optimal Advisory analysis, Bloomberg, Similarweb
We do note and monitor the risks. Among those. increased investment in courses, golf travel, apparel, consumables paired against the dollar and time golfers generally invest in the pastime means ROIC risks exist in any sustained recession. On the other hand, new, urban, technology-rich indoor concepts (e.g. TGL, advanced simulators) could create some offset to this risk – lowering the amount of time needed for the game and therefore driving golf lifestyle apparel and equipment in new ways.
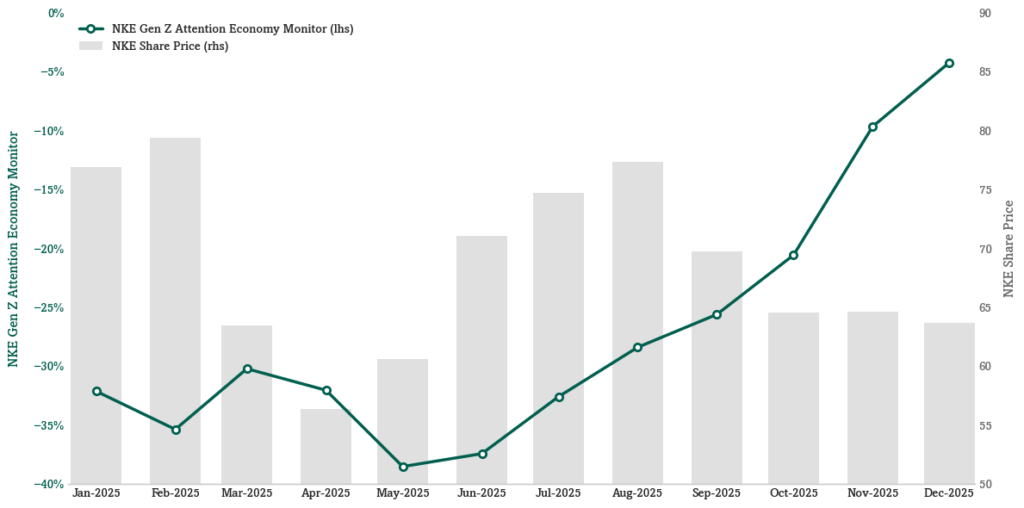
Both iconic and pressured, our analysis shows Nike (NKE) with substantially firmer trends with critical Gen Z consumers. Nike’s 65% share price drop since holiday 2021 stems from its well-documented problematic DTC strategy, lack of product innovation, headwinds from the China market, and rise of competitors. We monitor Gen Z brand connectivity and note a 2800 bp improvement in trends with these bellwether consumers since the start of the year. We believe new initiatives including Nike Mind, the reintroduction of Nike Golf Shield, NikeSKIMS including the Paris pop-up, and the Nike Therma-FIT Air Milano jacket for the US Olympic team are showing potential to further inflect this key cohort.
Figure 13: NKE Gen Z Attention Economy Monitor is Nearly Flat Y/Y
Source: Optimal Advisory analysis, Bloomberg, Similarweb
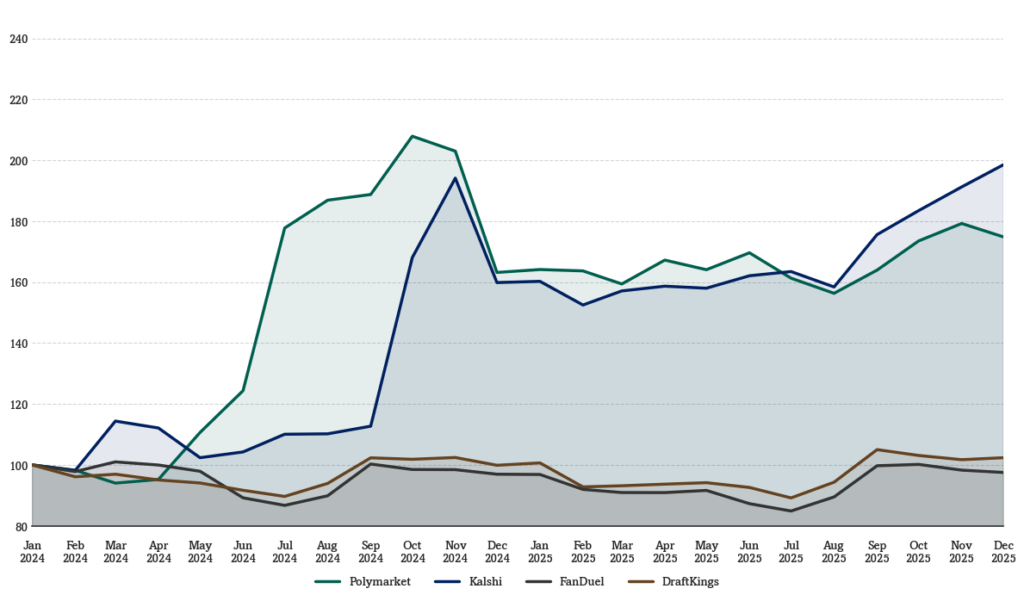
Sportradar (SRAD) provides a critical data layer to sports betting. Sportradar brings a unique, strategic value-add to the sports ecosystem that’s presently underappreciated due to dynamism in its end markets. Specifically, prediction markets present risk to their key betting platform customers (see figure 13 below). We note that prediction markets don’t need some of the services (e.g. pre-live odds updates), but we expect that as they become more robust and offer faster markets they will need fast, reliable data. For example, Kalshi and Statscore (another sports data provider) recently announced a partnership. As leagues -already SRAD customers – are beginning to partner with prediction markets, we see a pathway into these markets. We note that key betting customers DKNG and FLUT are unveiling prediction market offerings, which present opportunity. While the regulatory and competitive outlook has become less clear, we note 1) SRAD is the first mover with the best brand name in sports integrity technology, 2) the brand is very important given the “trust” aspect of the work, 3) they have many strategic options, 4) are cash flow generative so have time for those options to play out, and 5) are trading at an undemanding valuation (~11x EV/FCF).
Figure 14: Traffic to Prediction Markets and Sports Betting Platforms (Log Scale): Traffic to Polymarket and Kalshi is 30x and 90x Jan 2024 Levels Respectively
Source: Optimal Advisory analysis, Similarweb
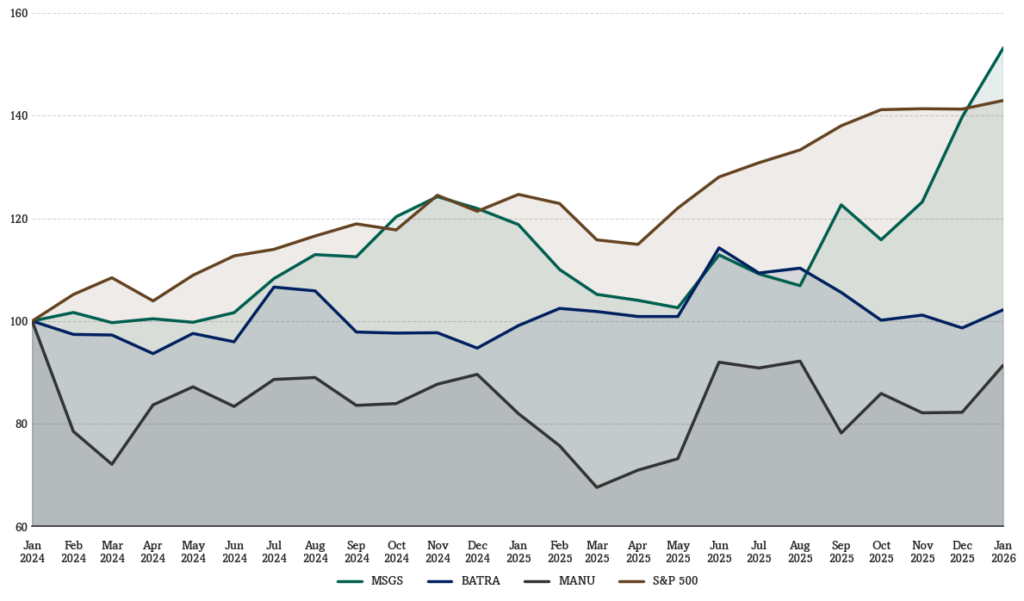
Sports team themselves (MSGS/MSGE, MANU, BATRA) may no longer be illiquid and overlooked as the financialization of teams and leagues interact with scarcity value. Sports team valuations are rising (outpacing the market at large) based on scarcity and the growth of sports within the economy. As the financialization of sports teams and leagues continues, we expect the relatively illiquid names may receive more attention.
Figure 15: Publicly Traded Sports Team Stock Performances
Source: Optimal Advisory analysis, Bloomberg